In this article
What is a Piping and Instrumentation Diagram?
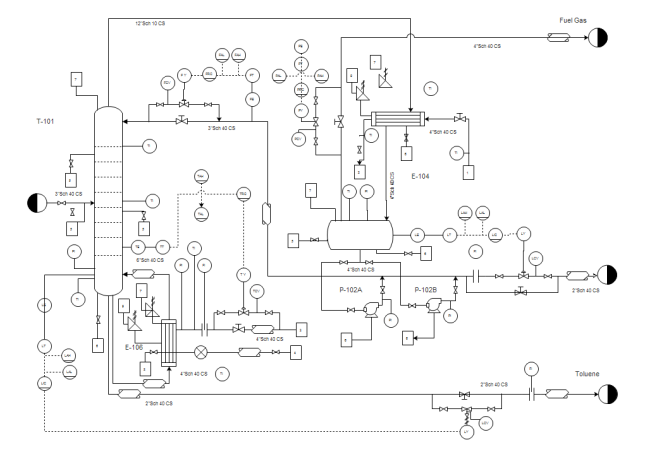
A piping and instrumentation diagram, also called P&ID, is a detailed technical drawing that provides a graphical representation of an entire industrial process system. It includes all piping, instruments, valves, and equipment within the system. Through a P&ID, you can access the following critical information:
- The mechanical and electrical details of a specific system or process,
- Comprehensive piping specifications including sizes and materials,
- Continuation flags that connect to related P&IDs,
- Flow direction indicators and DCS alarm types,
- Connection types from controllers to field devices,
How to Read P&IDs
Mastering P&ID interpretation requires understanding several key aspects. You need to recognize what P&ID symbols represent and how each symbol is constructed using graphical elements and connecting lines. Once you grasp these fundamentals, reading piping and instrumentation diagrams becomes significantly easier.
#1 Know the Letter and Number Combinations of a P&ID
Letter and number combinations appear inside each graphical element, with the ISA standard defining letter combinations while numbers are user-assigned. The first letter represents measured or initiating variables such as Analysis (A), Flow (F), Temperature (T), etc., with subsequent letters defining readout, passive, or output functions such as Indicator (I), Record (R), Transmit (T), and more.
Tag numbers are alphanumeric identifiers of varying lengths that help pinpoint the device, its control function, device type, and registration number on the P&ID. Physical instruments are marked by a tag number enclosed in a circle. These numbers also facilitate equipment location tracking.
The sequence and letters in tag numbers follow highly specific, unique conventions for each device. The first character specifies the factors controlled and monitored by the device, while the second character indicates the device type. Subsequent characters elaborate on the device's function and provide context for the remaining numbers in the sequence.
Standard Abbreviations Used in P&ID
Abbreviations are used in P&IDs to maintain diagram conciseness and clarity. The table below presents commonly used industry-standard abbreviations.
| AC | Analysis Controller | PB | Push-button |
| AE | Analyzer Element | P/I | Pneumatic To Current Converter |
| AAH | Analysis Alarm [High] | POV | Pneumatically Operated Valve |
| BE | Burner Element | pHT | pH Transmitter |
| BDV | Blowdown Valve | PSE | Rupture Disk |
| CR | Conductivity Recorder | PR | Pressure Recorder |
| ES | Electrical Switch | PZV | Pressure Relief Valve |
| FIT | Flow Indicator Transmitter | RC | Ratio Controller |
| FY | Computer, Relay, Amplifier or I/P Converter, etc. in Flow Loop | RO | Restriction Orifice |
| I/I | Current Indicator | RTD | Resistance Temperature Detector |
| KI | Clock/Timer | SA | Speed Alarm |
| LCV | LCV Level Control Valve | SD | Shutdown Panel |
| LIT | Level Indicator Transmitter | SV | Solenoid Valve |
| LO | Lock Open | TA | Temperature Alarm |
| MCC | Motor Control Center | TCV | Temperature Control Valve |
| MT | Motion Transmitter | TH | Thermostat |
| MTU | Master Terminal Unit | US | Utility Station |
| NC | Normally Closed | WE | Weight Measuring Element |
| NO | Normally Open | WS | Water Supply |
| PA | Pressure Alarm | ZV | Safety Shut-down (Pilot) valve |
#2 Identify and Understand Standard Equipment -Instruments
Recognizing symbols and shapes in P&ID drawings is essential for accurate interpretation. EdrawMax provides comprehensive symbol libraries required for professional P&IDs.
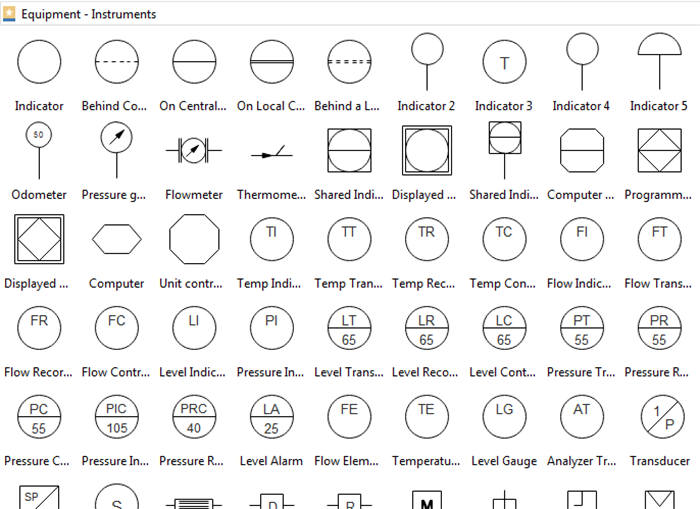
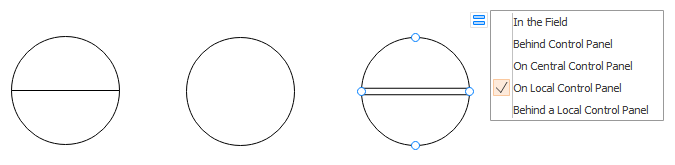
All instruments in a P&ID are represented by a circle containing an assigned tag number and line designation. The tag number identifies the specific device, while the line indicates its location. Line types classify instrument locations relative to the field. The primary line types used in P&IDs include:
Instruments Location
- No line: A plain circle indicates a field-mounted local instrument accessible to operators for direct observation and interaction.
- Solid Line: A central solid line signifies instruments located in primary control room positions, visible on front panels or video displays.
- Dashed Line: A dashed line specifies instruments in secondary control room locations that are not directly accessible to operators.
- Double Solid Line: Double solid lines indicate instruments in primary positions within local control centers, operator-accessible at panel fronts or consoles.
- Double Dashed Line: Double dashed lines describe instruments in secondary local control center positions, typically located in field cabinets without front-panel visibility.
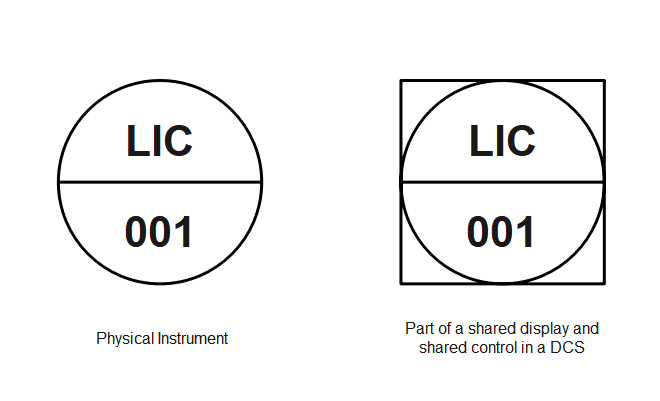
Shared Display and Shared Control
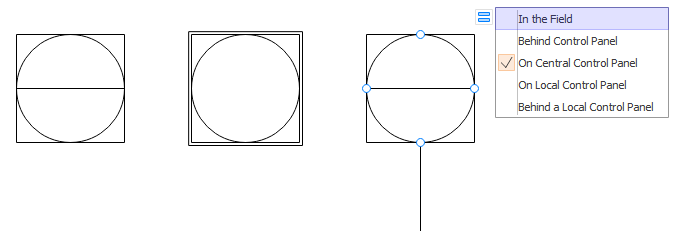
Shared display enables viewing the same information from multiple network locations, while shared control allows remote system interaction and operational modifications. Instruments with shared control and display systems are represented by a square around the tag number, indicating remote accessibility through a Distributed Control System (DCS).
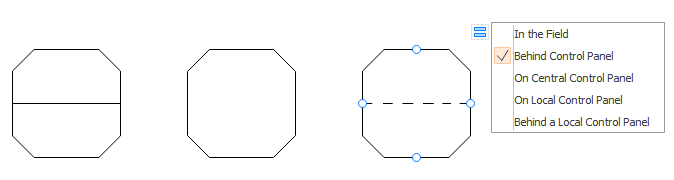
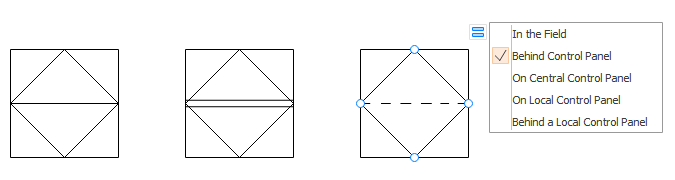
According to ISA S5.1 standards, four primary graphical elements exist: discrete instruments, shared control/display, computer function, and programmable logic controller. Circular elements represent discrete instruments, while shared control/display elements are circles within squares. Computer functions appear as hexagons, and programmable logic controller (PLC) functions are shown as triangles within squares. These shapes represent both physical hardware and software devices, providing comprehensive coverage for all P&ID requirements.
- Discrete instruments
- Shared control/display
- Computer function
- Programmable logic controller
#3 Learn to Use Graphical Elements and Connecting Lines
Connection lines between elements help engineers identify specific pipes through standardized color-coding and line styles that prevent confusion. A single horizontal bar across any graphical element indicates primary location placement, while a double line signifies auxiliary location. Devices behind panel boards in inaccessible locations are represented with dashed horizontal lines.
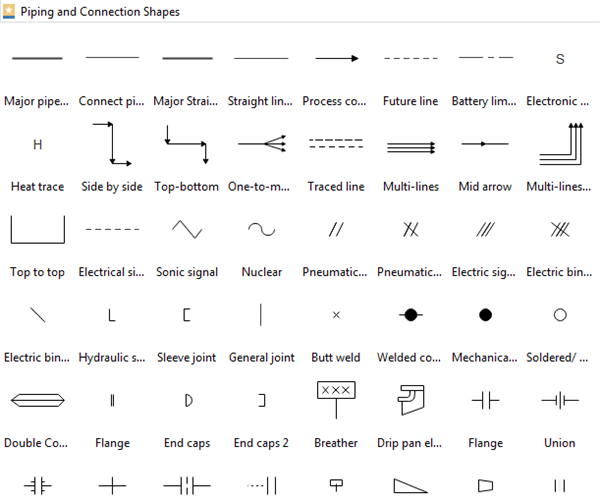
Connection lines on P&IDs illustrate relationships between instruments, their interconnection methods, and signal transmission types. For example, solid lines represent physical pipe connections, while dashed lines indicate electrical signal transmission. Understanding these symbols is crucial for accurate P&ID interpretation. The primary line types connecting devices and instruments include:
| Major Process Piping |  |
| Minor Process Piping | 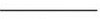 |
| Electrical Signal | 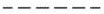 |
| Mechanical Link | 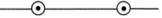 |
| Electromagnetic (Guided) Wave | 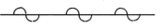 |
| Electromagnetic (Unguided) Wave |  |
| Pneumatic Signal |  |
| Software or Data Link | 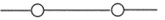 |
| Capillary Tubing | 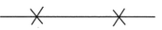 |
| Hydraulic Tubing | 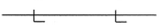 |
For more comprehensive information about Piping and Instrumentation Diagrams or EdrawMax capabilities, explore our resources further.
EdrawMax is a powerful, all-in-one, easy-to-use diagramming tool that enables users to visualize ideas effortlessly.
EdrawMax provides both beginners and professionals with advanced functionality to create professional-quality diagrams more efficiently, quickly, and cost-effectively! It supports creation of over 280 diagram types and serves as an excellent Visio alternative.
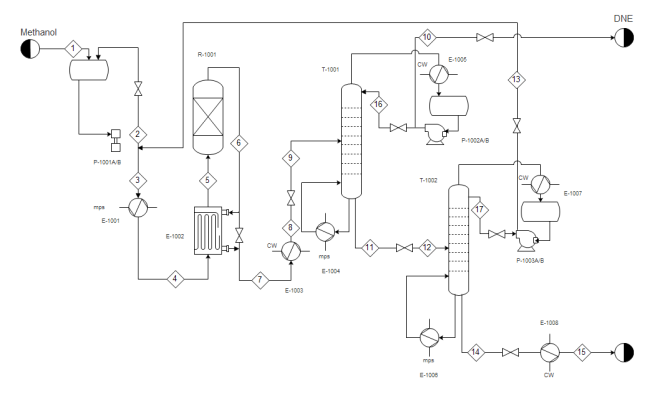
Piping and Instrumentation Diagram Examples
Explore these professional P&ID examples created with EdrawMax, available for free download and customization. For additional P&ID examples and templates, visit our Template Community.
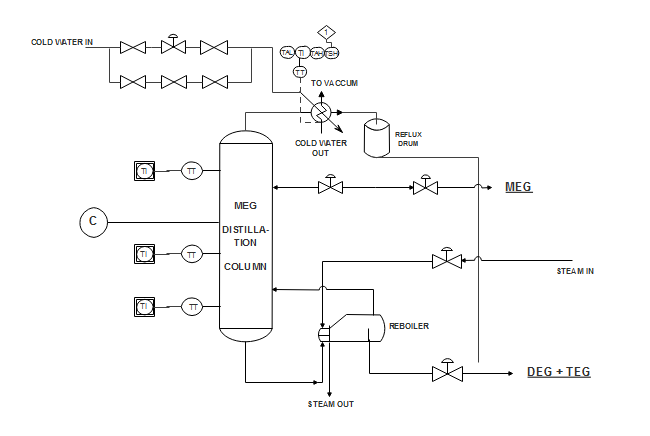
- Plant P&ID
- Water Boiling Process P&ID
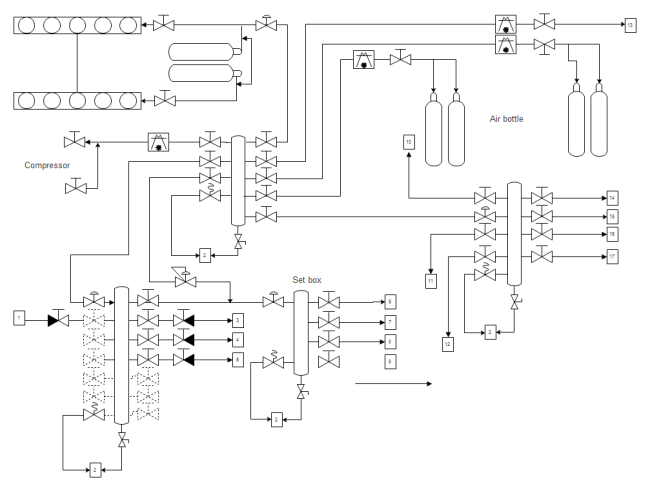
- System P&ID
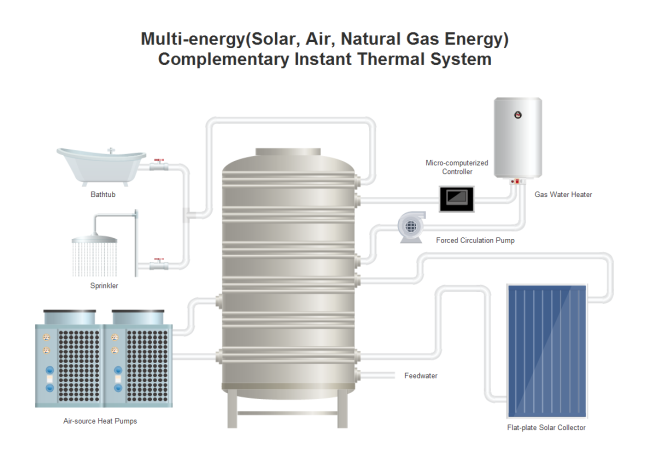
- Thermal System P&ID
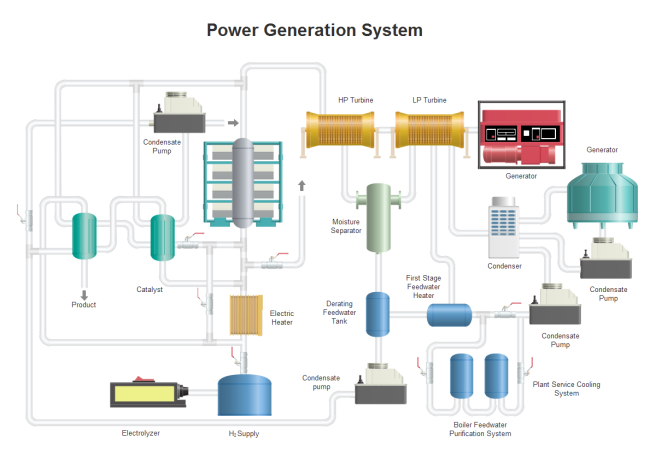
- Power Generation P&ID
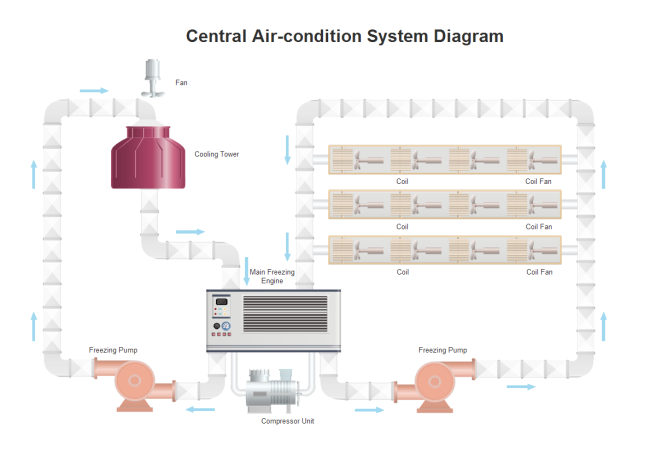
- Air Condition Process P&ID
EdrawMax is the versatile diagram software that integrates 100% functionality and libraries of all other drawing products.