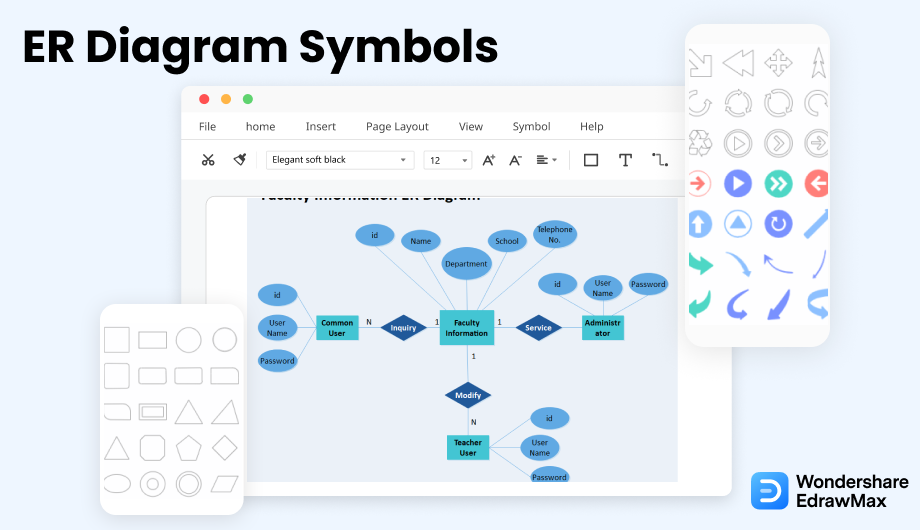
A Guide to ER Diagram Symbols and Notations
Ready to Create Your ER Diagram?
EdrawMax specializes in professional diagramming and visualization. This comprehensive guide covers everything you need to know about ER Diagram symbols and how to use them effectively. Start designing with ease today!
ER diagram symbols are fundamental components that visually represent the data structure within an application. They provide a simplified overview of database organization by illustrating data relationships. A schema encompasses facts about individual entities, such as persons or businesses.
These symbols serve as the foundation for relational database design rather than final solutions. For existing applications, an entity relationship diagram (ER Diagram) helps developers comprehend database architecture. Effective database planning requires understanding application tables and their interrelationships.
1. Understanding ER Diagram Symbols
Entity-relationship modeling employs ER Diagram symbols as conceptual design elements that model objects as abstract data types and their relationships as predicates.
The ER Diagram illustrates relationships between entities (tables) and primary key-foreign key connections. An entity represents a real-world object, person, or organization. Tables consist of rows and columns representing data records. The primary key-foreign key relationship defines connections between entities, identifying linking attributes and keys.
These symbols form a conceptual design approach that models objects as abstract data types and their interrelations as predicates.
2. Types of ER Diagram Symbols
Mastering ERD symbol types is crucial for understanding relational database design. For those learning relational databases, ERDs provide excellent insight into fundamental concepts and their practical applications.
ER Diagram symbols are categorized into three primary types, with numerous notation styles available. Below are the main categories of ER Diagram symbols.
Edraw ER diagram software provides pre-drawn symbols including entities, weak entities, relationships, attributes, derived attributes, constraints, and participation indicators.
While various ER diagram notations exist with minor differences, this article provides a concise overview of the most prominent styles and their distinctive features.
EdrawMax
All-in-One Diagram Software
- Superior file compatibility: Import and export drawings to various file formats, such as Visio
- Cross-platform supported (Windows, Mac, Linux, Web)
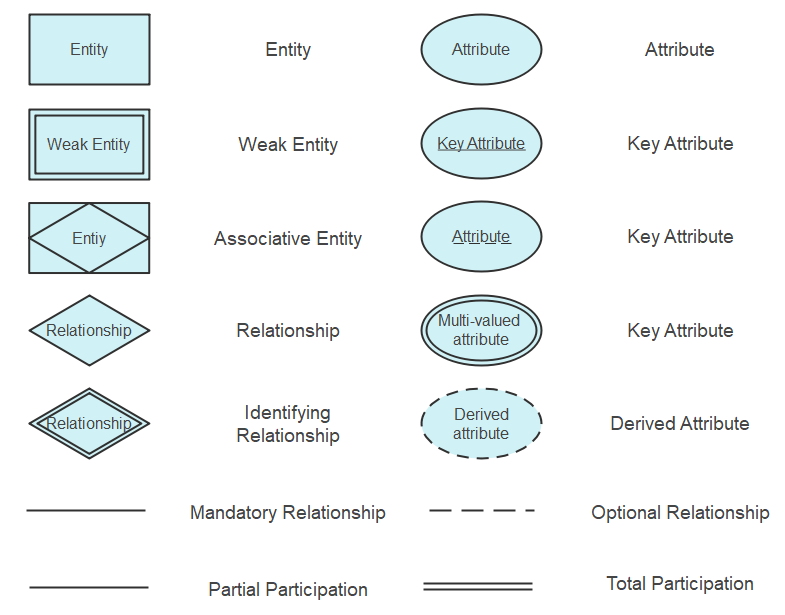
2.1 Chen ERD Symbols
Peter Chen pioneered the Chen ERD notation, becoming one of the first proponents of ERD in database design.
The entity represents one of the most fundamental symbols in ER diagrams. Continue reading for detailed elaboration.
Source: EdrawMax
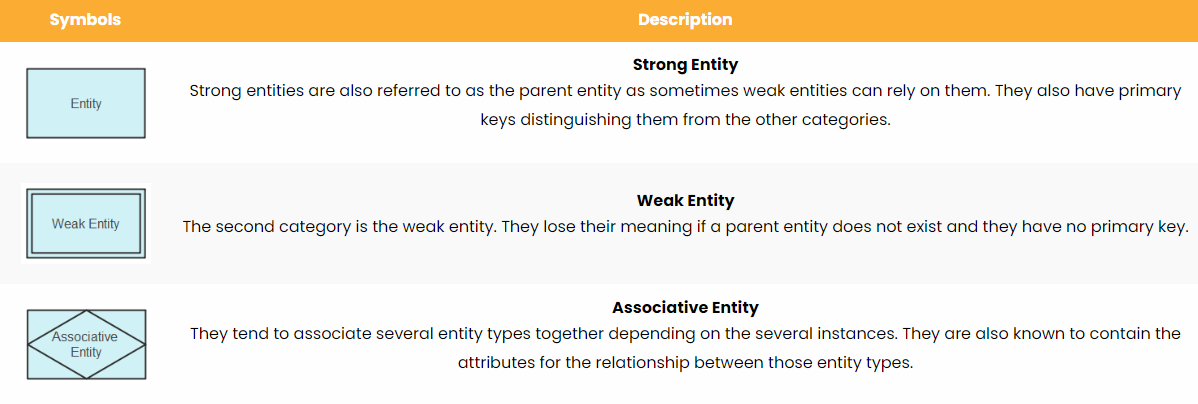
ERD Entity Symbols
An entity represents any element within an organization or system that requires database representation. Typically nouns like customers, locations, concepts, events, or persons, entities are crucial for data representation. These entities comprise attributes that further define their characteristics.
Source: EdrawMax
Understanding Entity Sets
An entity set refers to a collection of similar entities that share common values and possess attributes of identical nature.
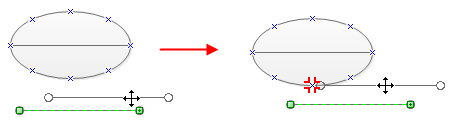
Connecting entity symbols with connectors is straightforward. Simply move the connector toward the shape until green alignment marks appear. A red mark indicates successful connection between elements.
Source: EdrawMax
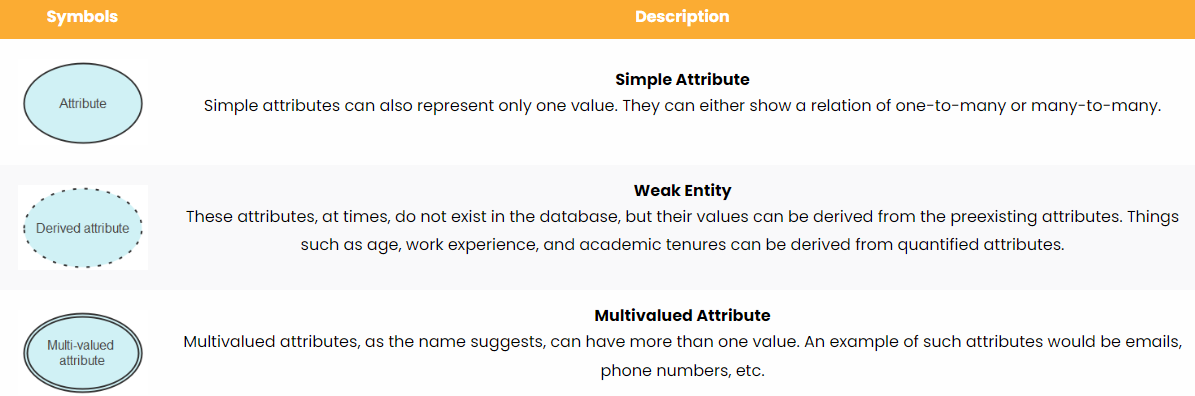
ERD Attribute Symbols
Attributes constitute the second essential component in ER diagram creation. An attribute represents a characteristic related to an entity, providing detailed understanding of database elements.
Similar to entities, attributes are classified into distinct categories as shown below.
Source: EdrawMax
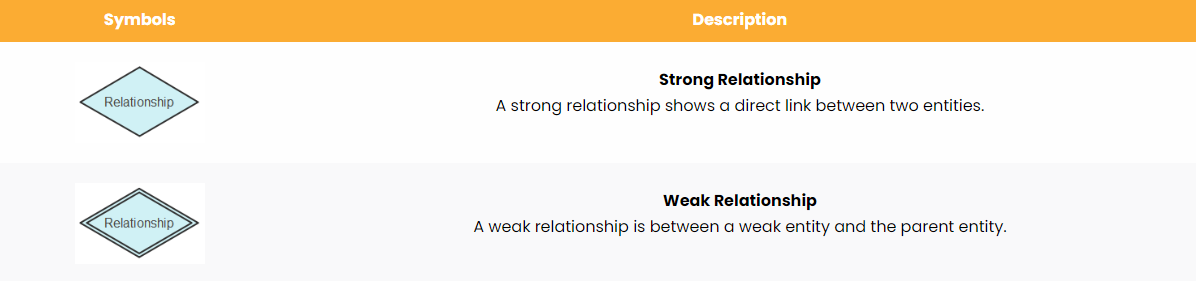
ERD Relationship Symbols
A relationship establishes associations between entities, typically represented by verbs or verb phrases.
Relationships are categorized based on association strength between entities, with classifications as follows.
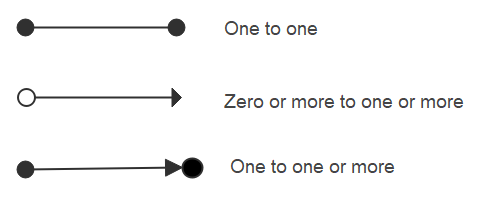
2.2 Crow's Foot Notations
Gordon Everest developed the Crow's Foot notation in a 1976 article for the Fifth Computing Conference. Originally termed "inverted arrow notation," the name Crow's Foot prevailed. The notation employs these distinctive symbols:
Source: EdrawMax
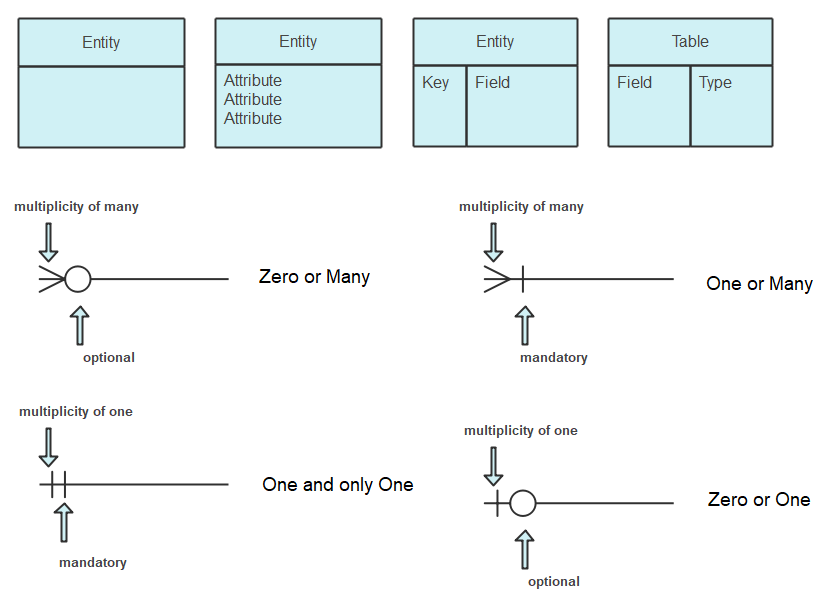
ERD Table Symbols
Tables provide an alternative representation of entities, serving as essential components in physical ER diagrams. Tables display entities with related attributes listed beneath, referred to as fields in physical ER diagrams.
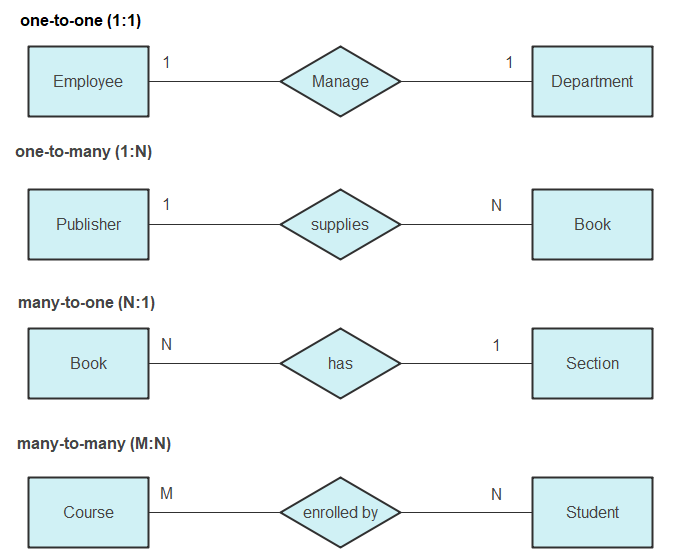
Understanding ERD Cardinality
Cardinality defines the maximum number of relationships an entity can establish with another entity instance. Ordinality specifies the minimum number of such relationships. Typically, ER diagrams use cardinality to encompass both concepts.
Cardinality constraints operate within defined maximum and minimum numerical limits relevant to relationships.
Different line stylings represent various cardinality types in diagrams.
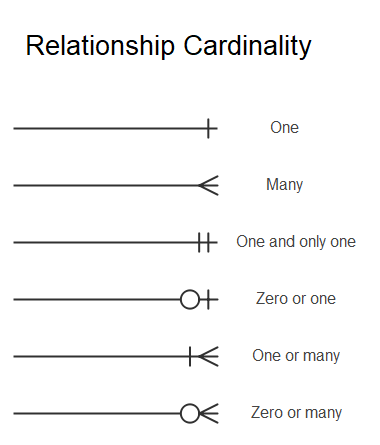
Source: EdrawMax
- One to One: The origin entity maintains a one-to-one association with another entity
- Many: The target entity can relate multiple times to the origin entity (one-to-many relationship)
- One and Only One: The origin entity links exclusively to one other entity
- One or Many: The origin can establish single or multiple links with another entity set
2.3 UML Notation
UML excels at documenting, visualizing, and specifying components for both software and non-software systems. With numerous diagram types, UML divides into behavioral and structural information representation.
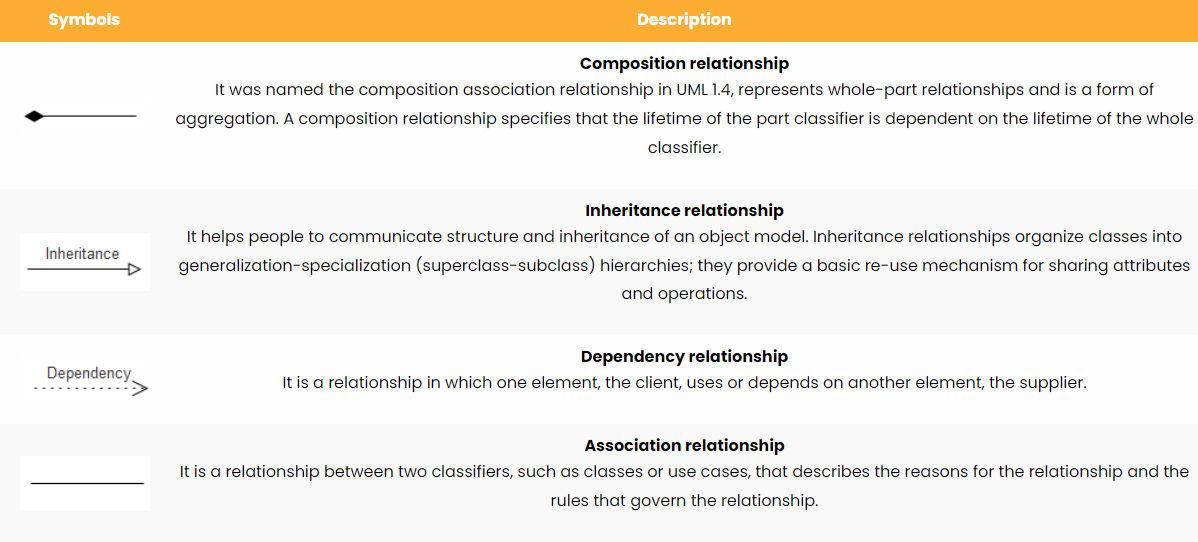
Source: EdrawMax
2.4 Barker's Notation
This notation system provides specialized symbols for representing database relationships and constraints with distinctive visual markers.
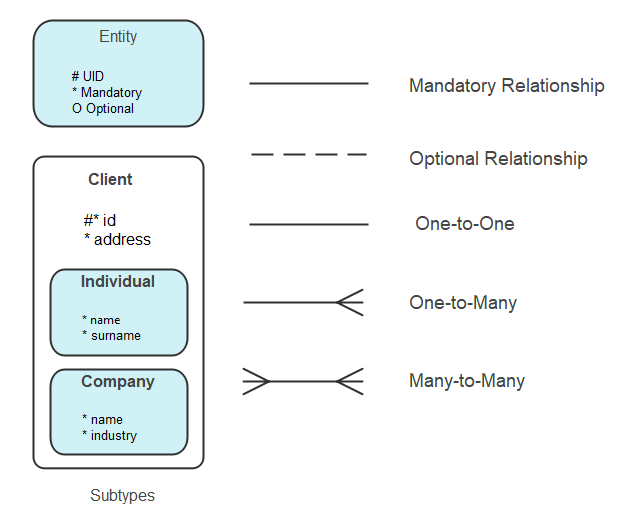
Source: EdrawMax
2.5 Bachman Notation
Computer scientist Charles Bachman developed this notation, building upon Chen notation to create an alternative symbol set. As a database pioneer, his contributions significantly advanced database design methodologies.
Source: EdrawMax
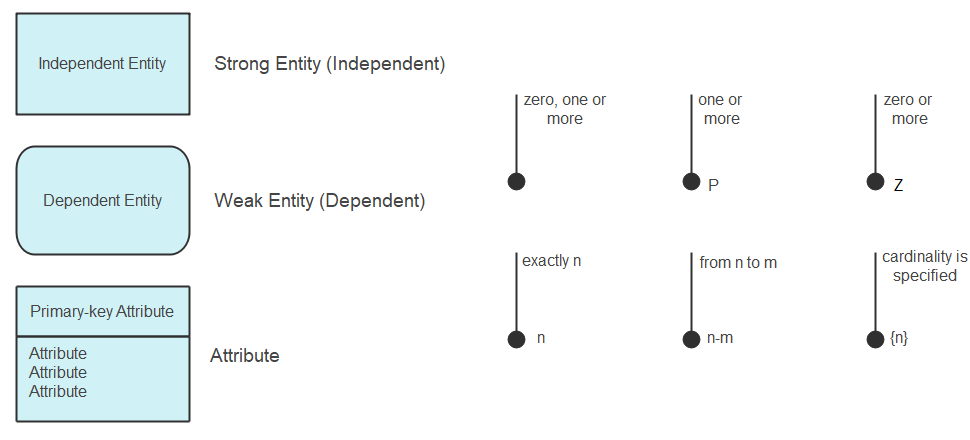
2.6 IDEF1X Notation
Known as Integration Definition for Information Modeling, IDEF1X emerged from 1970s US Air Force requirements for semantic data models. The ICAM program evolved into IDEF1X, employing specific syntax for relational database creation.
Source: EdrawMax
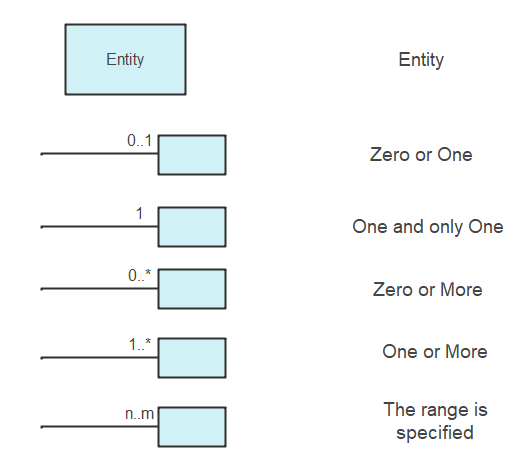
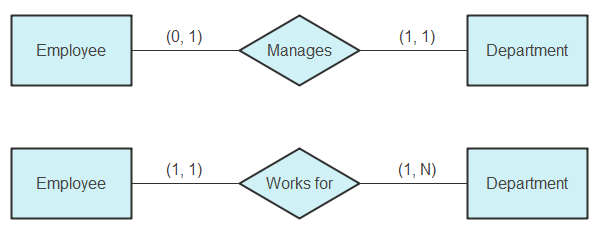
2.7 Min-Max Notation/ISO Notation
Jean Raymond Abrial introduced Min-Max Notation in 1974 to address limitations in Chen notation regarding minimum and maximum constraints. This notation forms part of semantic database modeling systems.
Source: EdrawMax
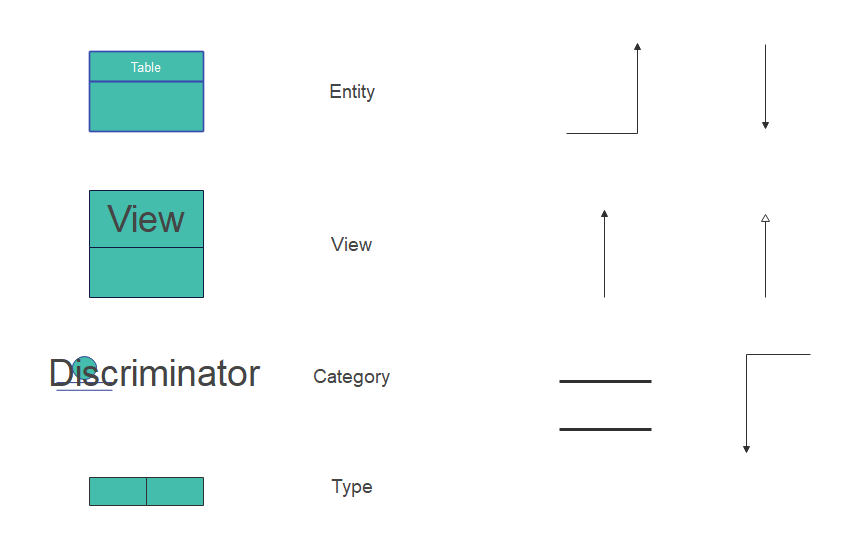
2.8 Object Relationship Symbols
Object relationship symbols encompass entities, relationships, views, parent-child categories, table inheritance, types, type inheritance, and dynamic connectors.
Relationship types depend on how related objects are defined within the system architecture.
Type inheritance provides additional properties through hierarchical organization within structured complex data systems.
Source: EdrawMax
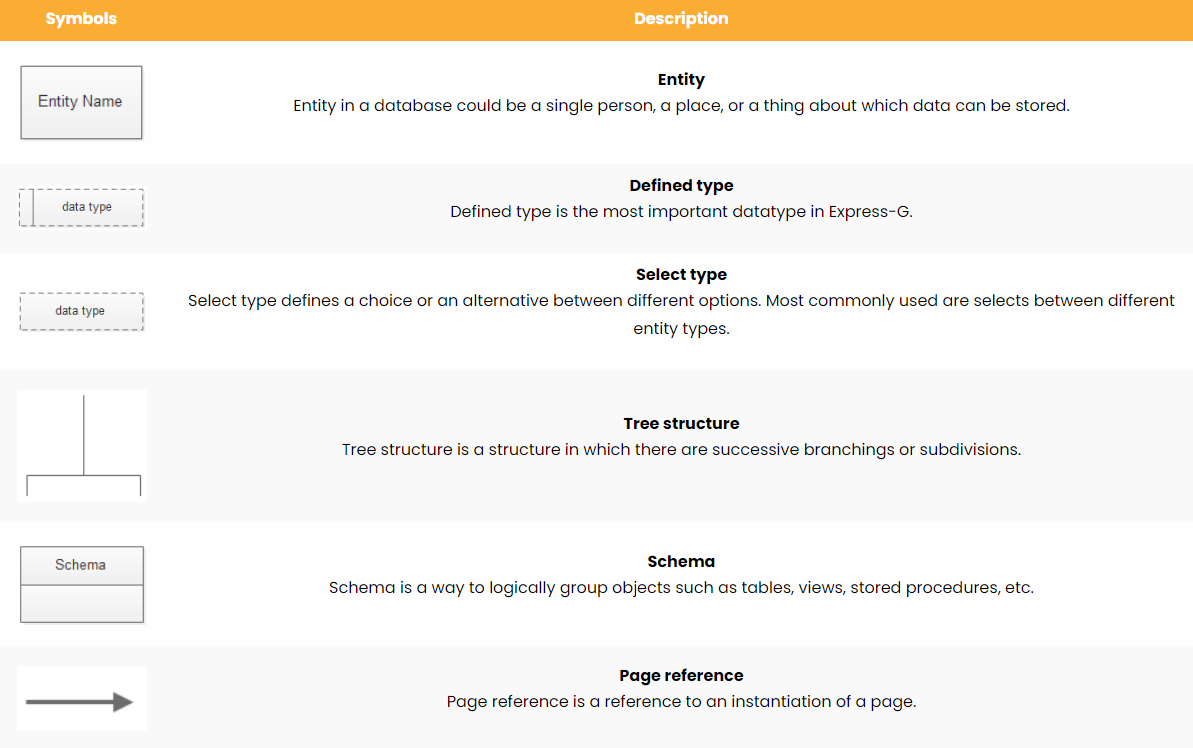
2.9 Express-G Symbols
This notation system provides specialized symbols for representing complex data relationships and structural elements in information modeling.
Source: EdrawMax
2.10 Martin ERD Symbols
This notation system offers comprehensive symbols for representing database relationships, inheritance structures, and complex data interactions.
Source: EdrawMax
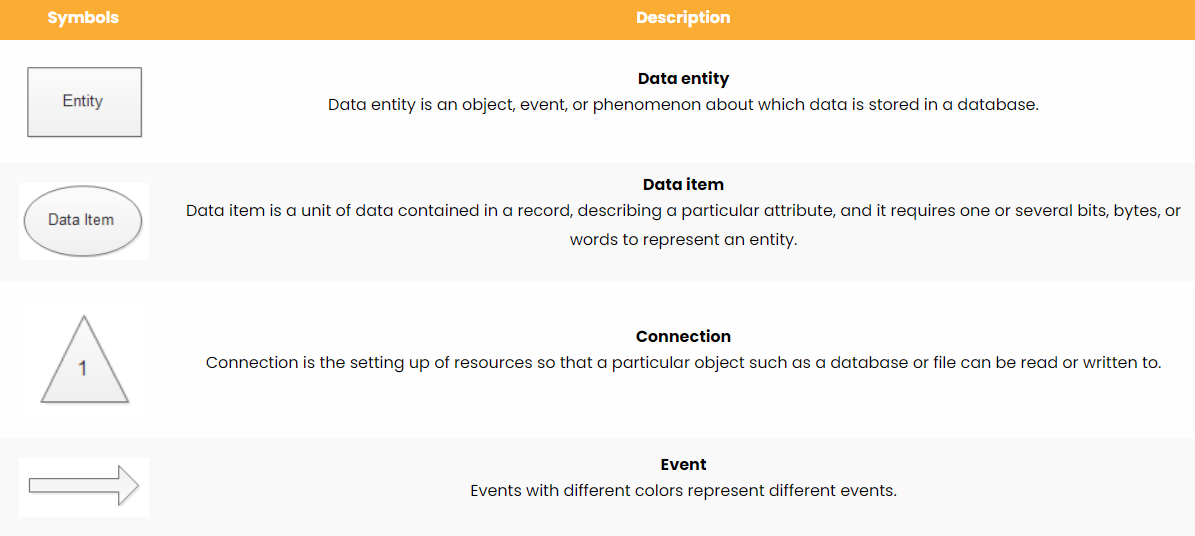
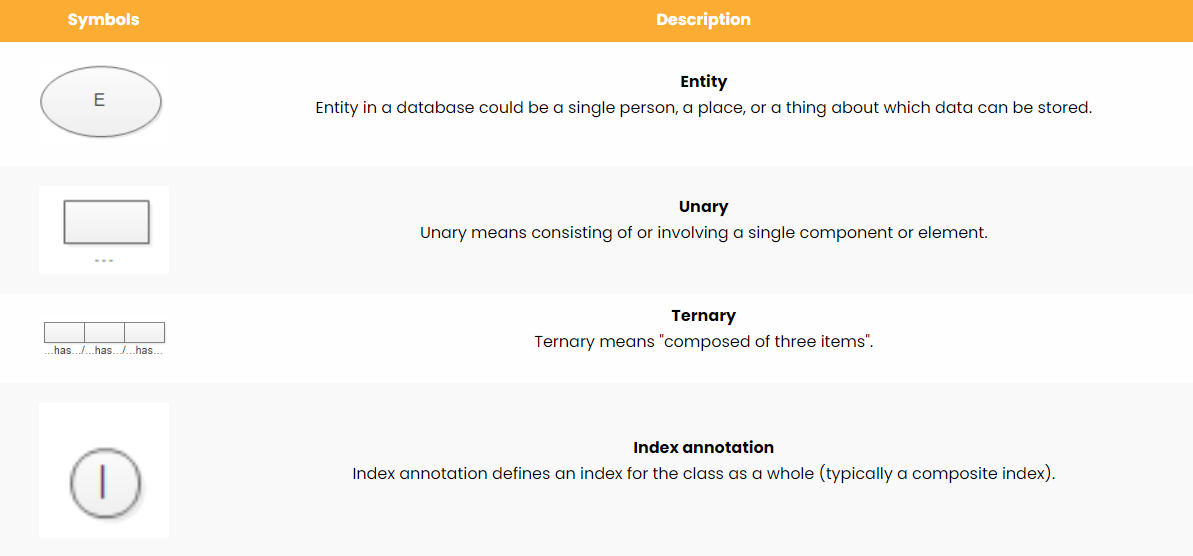
2.11 ORM Diagram Symbols
Object-Role Modeling symbols provide sophisticated representation of database relationships, inheritance patterns, and complex data structures.
Source: EdrawMax
3. Where to Find ER Diagram Symbols
Creating detailed ER diagrams requires access to proper symbols that clearly represent each component. You can easily locate comprehensive ER diagram symbols in EdrawMax's symbol library.
EdrawMax provides access to over 26,000 symbols for creating ER diagrams and other diagram types. Simply navigate to the ER diagram category and use intuitive drag-and-drop functionality to incorporate any required symbols.
As the premier resource for ER diagram symbols, EdrawMax offers hundreds of specialized symbols. Simple drag-and-drop functionality enables effortless ER diagram creation.
4. How to Use ER Diagram Symbols
Follow these instructions to master ER diagram symbol usage and create additional symbols efficiently using EdrawMax's comprehensive tools.


EdrawMax features an extensive collection of pre-drawn ER diagram symbols. Begin by dragging and dropping required symbols, then export completed diagrams to multiple formats including PPTX, XLSX, and PNG.
5. ER Diagram Examples & Templates
EdrawMax's template community offers pre-made templates that can be customized to meet professional requirements. These ER diagram examples help visualize different notation styles. Explore these ER diagrams from our template community.


6. Free ER Diagram Software
There are many different kinds of ER diagram software available in the market. The best one that you can find is EdrawMax. It comes with a complete set of features to help you create a detailed and complex ER diagram. It also provides ER diagram templates that you can customize to fit your needs.
This software comes with a wide variety of features that make it easy for you to create a beautiful ER diagram. It also offers a lot of ER diagrams and templates to get you started quickly.

EdrawMax is the best solution for all your needs. From making a simple ER diagram to a detailed and complex one, this tool will help you with all your requirements. It also provides a lot of tools for editing and customizing your diagram.
7. Final Thoughts
ER diagrams are a great way to show the relationship between different entities in your database. They provide a clear and concise way to visualize the data and its relationships. The symbols in an ER diagram are an essential part of the diagram and help to make it more understandable. ER diagram symbols are a good way to present your data and its relationships.
By using ER diagram symbols you can create a detailed and complex ER diagram. This will help you to have a better understanding of the data in your database. These symbols are essential for any professional who wants to make a database. The ER diagram is a great way to present your data and its relationships. We hope that this article has been helpful in helping you to understand the different ER diagram symbols and how they are used.
You May Also Like


