In today's complex business environment, organizations face numerous challenges that require systematic problem-solving approaches. When production quality declines, customer satisfaction drops, or processes malfunction, teams need a structured method to identify root causes rather than just addressing symptoms. The fishbone diagram (also known as an Ishikawa diagram or cause-and-effect diagram) has been a cornerstone of quality management since its development by Dr. Kaoru Ishikawa in the 1960s.
While the methodology remains highly effective, traditional creation methods using whiteboards and sticky notes present limitations in our digital age. EdrawMax transforms this proven analytical tool by providing an intuitive digital platform that enhances collaboration, simplifies the creation process, and enables professional-looking results that can be easily shared and updated across organizations.
In this article
WHAT IS A FISHBONE DIAGRAM?
A fishbone diagram is a powerful visualization tool that helps teams systematically identify and categorize the potential causes of a problem to determine its root causes. The diagram gets its name from its distinctive structure—resembling a fish skeleton, with the "head" representing the problem statement and the "bones" representing various categories of causes branching off from the main spine.
This structured approach to root cause analysis ensures comprehensive examination of all potential factors contributing to an issue. The fishbone diagram is particularly valuable because it:
- Provides a visual representation of complex relationships between causes and effects
- Encourages holistic thinking by considering multiple perspectives and categories
- Facilitates organized brainstorming sessions that maximize team input
- Helps distinguish between surface symptoms and underlying root causes
- Creates a shared understanding among team members and stakeholders
- Serves as a permanent record of the analysis process for future reference
When Should You Use A Fishbone Diagram?
Fishbone diagrams are versatile tools applicable across various scenarios and industries:
- Complex Problem Solving
When facing multifaceted problems with multiple potential causes, such as declining product quality, increasing customer complaints, or recurring operational failures, the fishbone diagram helps organize and structure the investigation process systematically.
- Process Improvement Initiatives
For organizations implementing continuous improvement methodologies like Six Sigma, Lean Manufacturing, or Total Quality Management, fishbone diagrams provide a standardized approach to identifying improvement opportunities and eliminating waste.
- Team Brainstorming and Collaboration
When you need to leverage collective knowledge and experience from cross-functional teams, the fishbone diagram structure guides productive brainstorming while keeping discussions focused and comprehensive.
- Preventive Action Planning
By identifying potential causes of future problems, teams can develop preventive measures before issues occur, particularly valuable in risk management, quality assurance, and safety planning.
- Root Cause Analysis in Incident Investigation
Following accidents, failures, or significant events, fishbone diagrams provide a structured framework for investigating what happened and why, ensuring all potential factors are considered.
Advantages of a Fishbone Diagram
The enduring popularity of fishbone diagrams stems from their numerous benefits:
- Structured Problem-Solving Approach
Provides a clear framework that guides teams through the analysis process, ensuring completeness and reducing the chance of overlooking important factors.
- Visual Clarity
Transforms complex problems into clear, visual representations that are easier to understand and communicate to stakeholders at all levels.
- Comprehensive Analysis
Encourages consideration of all possible causes across multiple categories, preventing narrow focus on obvious or familiar factors.
- Team Engagement and Collaboration
Facilitates participation from diverse team members, leveraging different perspectives and areas of expertise for more thorough analysis.
- Root Cause Identification
Helps teams drill down beyond symptoms to identify fundamental causes, leading to more effective and lasting solutions.
- Knowledge Documentation
Creates a visual record of the analysis process that can be referenced later, used for training, or applied to similar problems.
How to Use the Fishbone Diagram with EdrawMax
EdrawMax is a versatile diagramming solution designed to simplify the creation of professional Cisco network diagrams. It’s suitable for students, educators, IT specialists, and organizations of all sizes. With a user-friendly interface and powerful functions, the tool makes diagramming straightforward—even beginners can quickly dive in and start designing.
Step1Open EdrawMax and Select a Fishbone Template
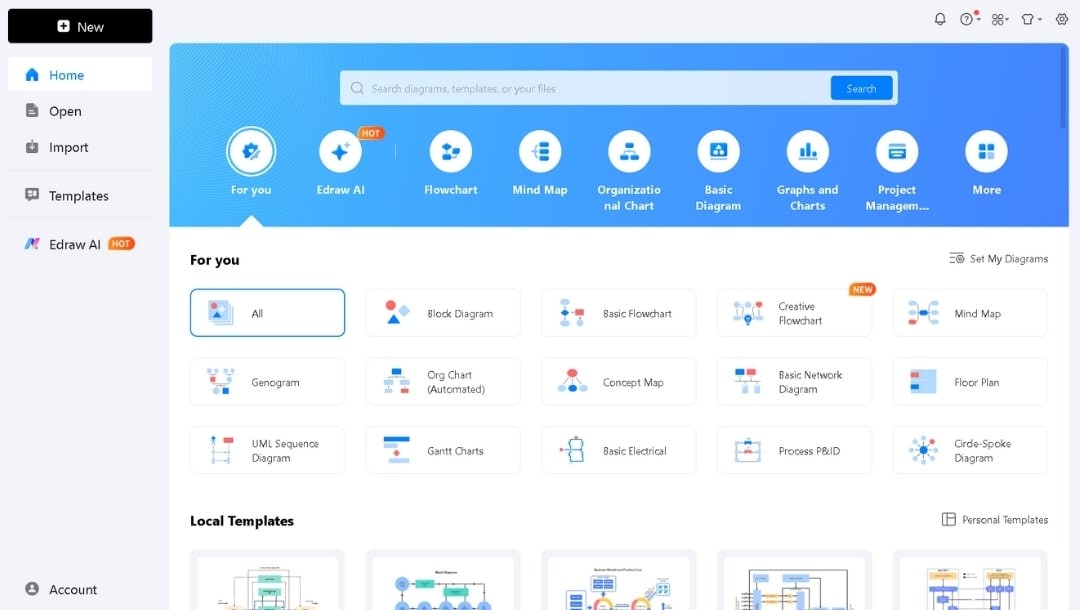
Run EdrawMax on your desktop and click More from the Home screen categories.
You can also search for a Fishbone/Ishikawa diagram in the search bar to find relevant templates.
- Choose the Quality Management section.
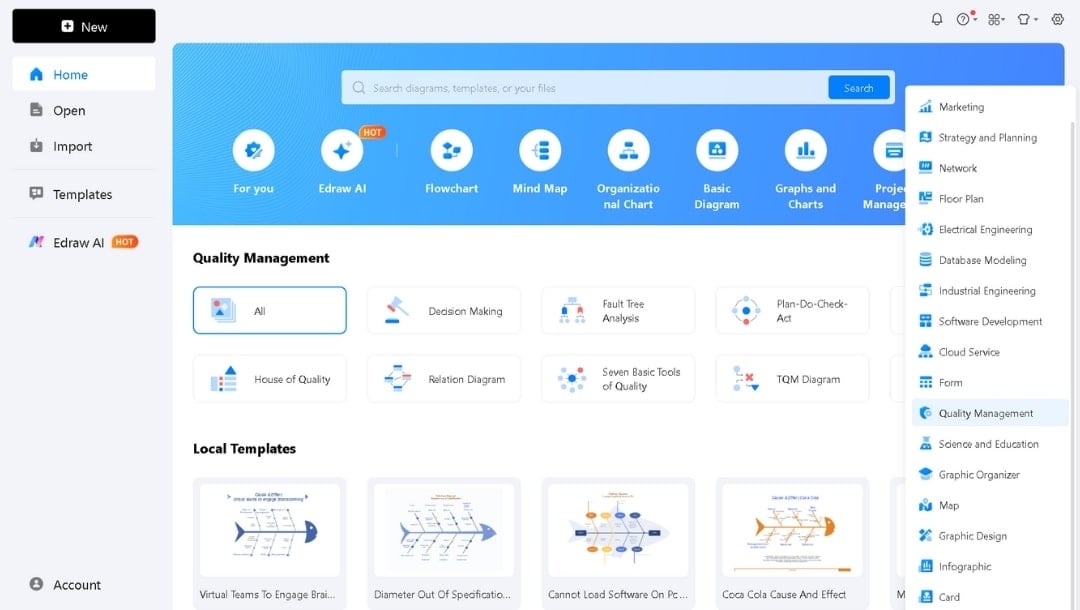
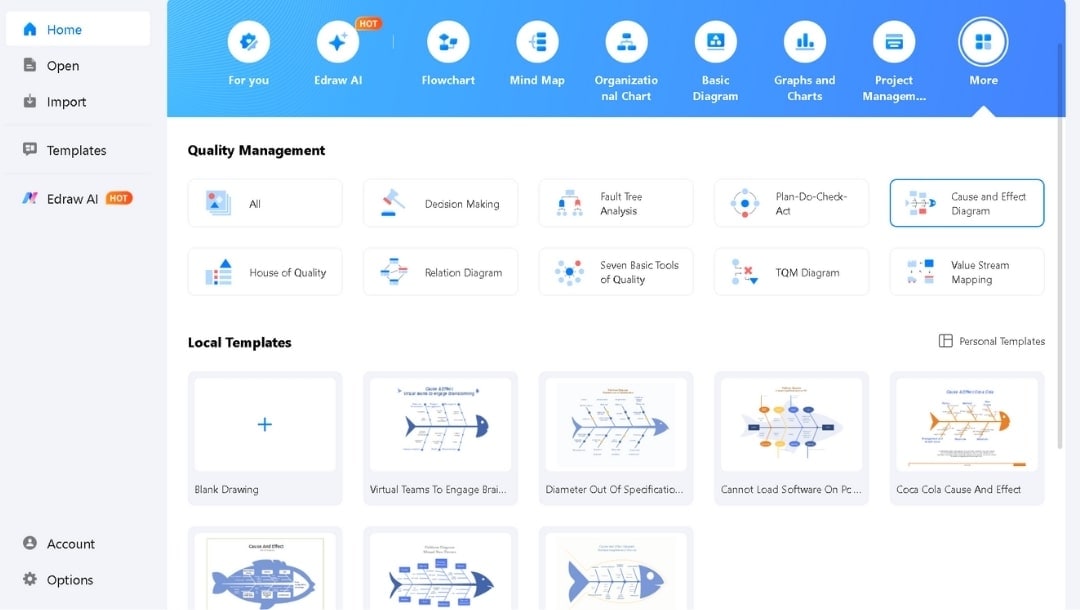
- Open the Cause and Effect Diagram. Built-in templates provide a professional design without requiring you to start from scratch.
- If the Local Templates don’t match your task, scroll to see community templates. Many are built for specific sectors and everyday challenges. Use them for workflow studies or production troubleshooting.
- EdrawMax offers advanced flexibility. You can use a ready-made template as is or customize every detail to fit your specific needs.
Step2Edit Placeholder Text to Add Your Data
- Take the template and fill it with your details.
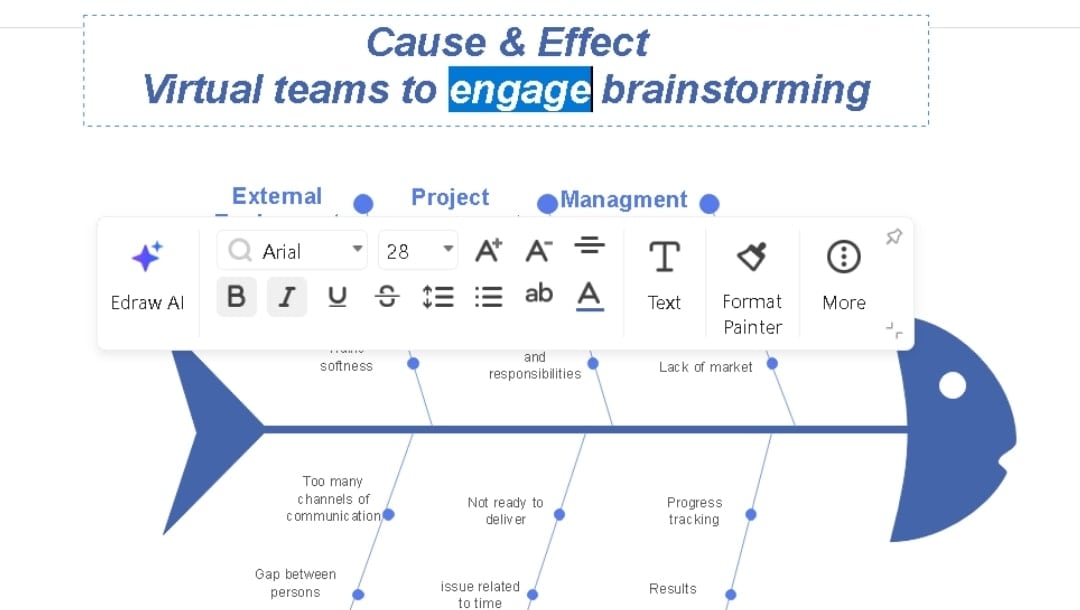
- Double-click any text box in EdrawMax to replace the placeholder words.
- Start by entering the main issue or effect at the diagram head.
- Move to the branches and label them with key categories, such as Man, Machine, Material, Method, or Measurement, or other relevant categories to your analysis.
- Under each branch, type potential causes.
- EdrawMax maintains a neat design, allowing you to update everything without disrupting the layout.
Step3Customize Layout and Design
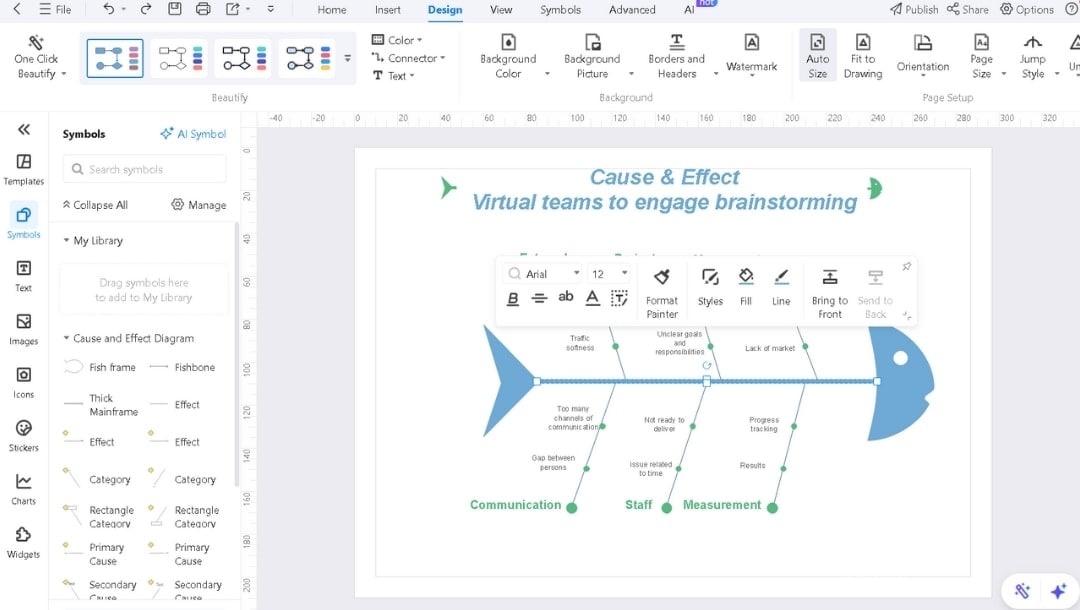
- Once your causes are identified, give the fishbone diagram a clear and professional look. EdrawMax lets you customize fonts, layouts, and colors with minimal effort. Color-coding related branches makes categories easy to recognize.
- For a quick, unified style, use the One-Click Beautify option in the Design tab to apply a full theme instantly.
- You can also modify line styles and branch placement for a cleaner result from the pop-up menu on a selected item.
- A well-designed diagram highlights causes clearly and saves time when sharing.
Step4Review and Export Your Diagram
- Give the fishbone one last check. Confirm each category label. Verify that all causes sit under the right branches. Select and hit the Delete button to remove duplicates and add any missing factors.
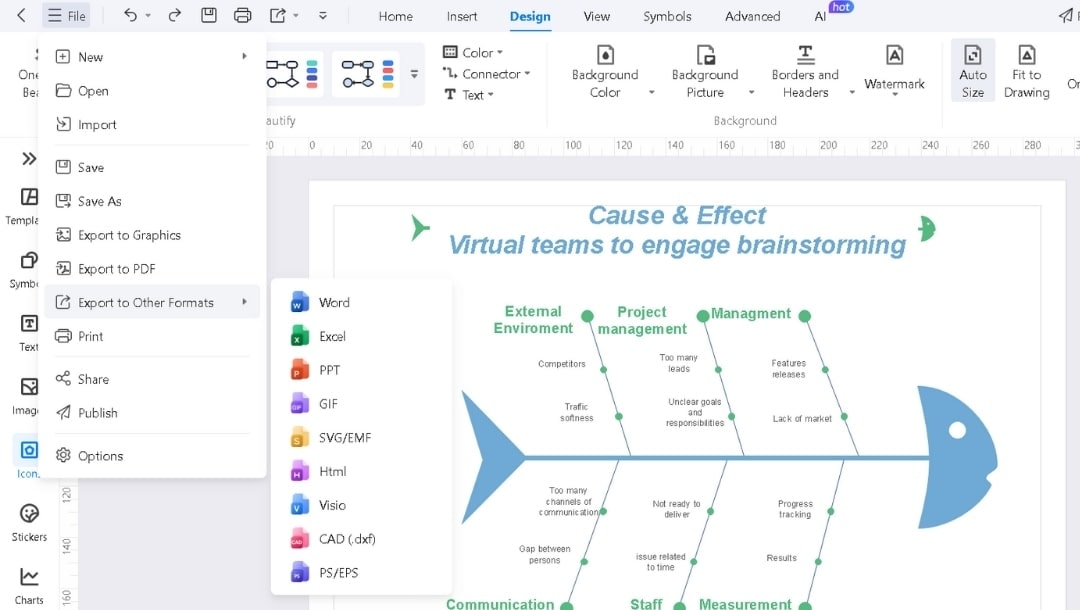
- Choose Export from the File menu in EdrawMax. Save as PDF, PNG, SVG, or Visio (VSDX). These formats ensure platform compatibility.
- Keep a local copy to edit later when new causes appear. (CTRL+S)
Examples of Fishbone Diagram in EdrawMax
Example 1: Fishbone Diagram for Education
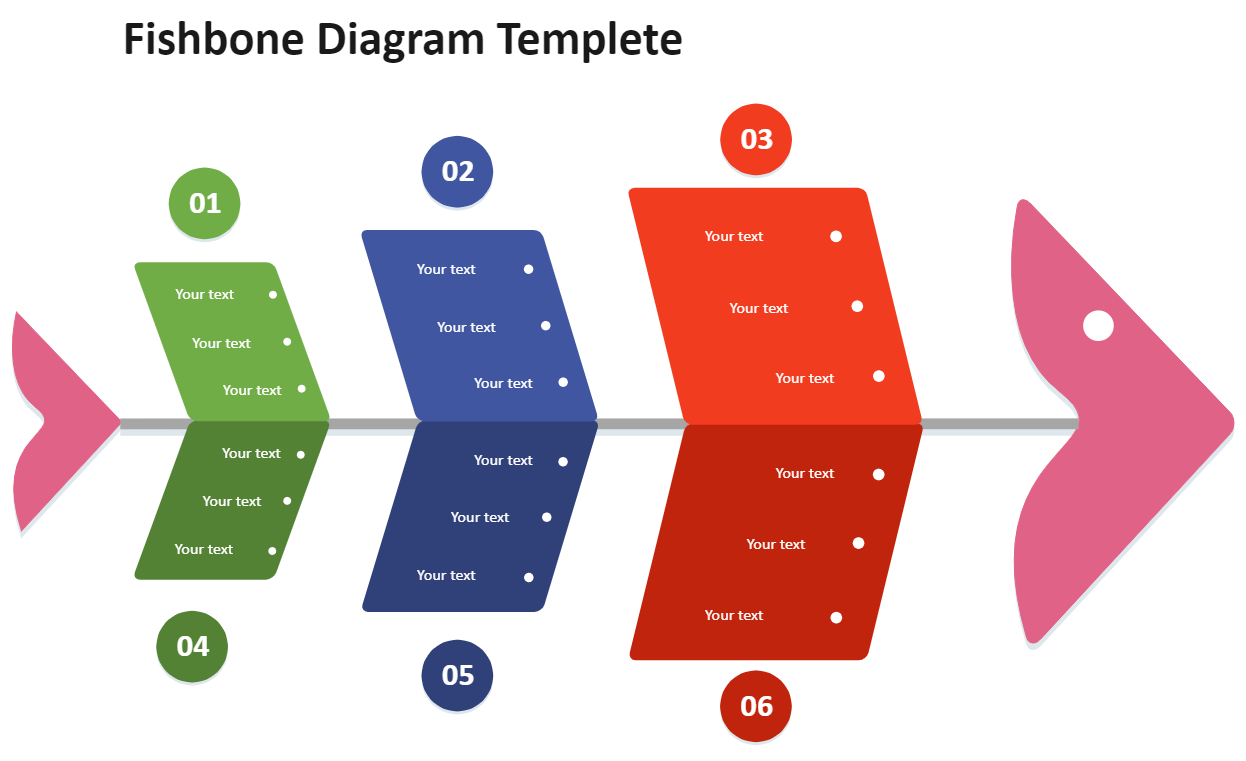
This fishbone diagram can be used to analyze various aspects of education. It helps you compare different teaching and learning methods, identify similarities, and understand key differences, promoting a more effective learning environment.
Example 2: Fishbone Diagram for Productivity
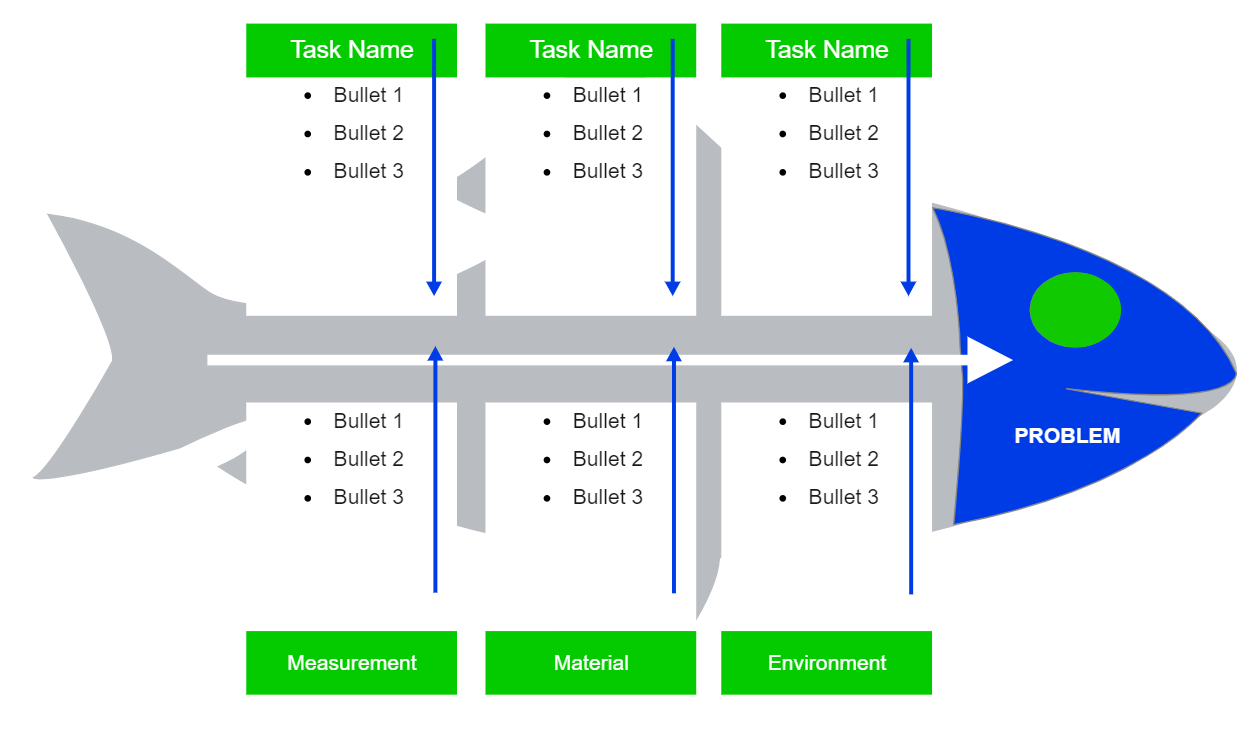
This fishbone diagram is perfect for anyone looking to improve their productivity. It helps you analyze your goals and values to serve a niche that wants to solve a problem. It provides a clear framework to help customers become more effective and efficient.
Example 3: Fishbone Diagram for Time Management
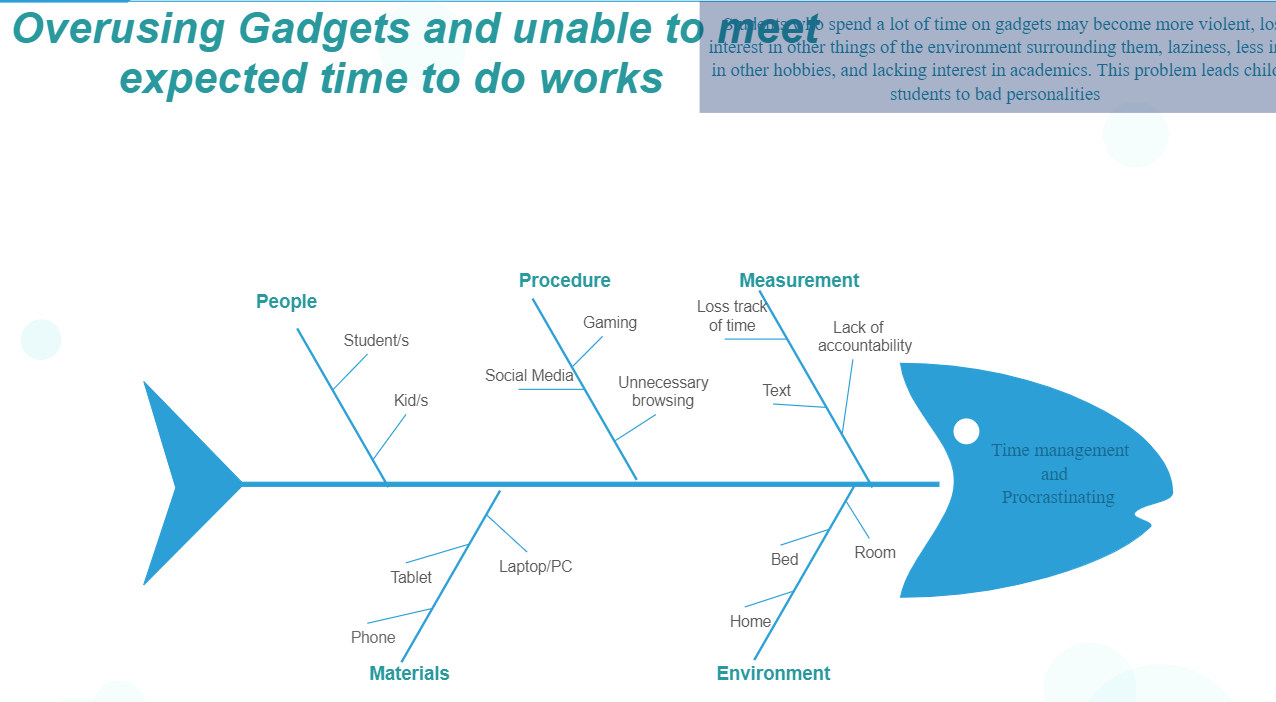
This example explores the effects of students' excessive cell phone use, a common issue in today's world. The fishbone diagram template highlights how a dependence on technology can lead to poor time management and social isolation. It serves as a visual guide to identify the various contributing factors.
Tips for Creating a Cause-and-Effect Analysis Using the Fishbone Diagram
Leverage EdrawMax's Template Library
Start with industry-specific templates rather than blank canvases. EdrawMax offers templates for manufacturing, healthcare, software development, and more, saving setup time and ensuring best practices.
Utilize Visual Enhancement Features
Use color coding strategically—red for urgent issues, green for resolved items, yellow for ongoing investigations. EdrawMax's styling tools make this easy and consistent.
Maximize Collaboration Capabilities
Schedule live editing sessions using EdrawMax's real-time collaboration. Assign different categories to team members based on their expertise for more efficient brainstorming.
Attach Supporting Documentation
Use EdrawMax's attachment features to link directly to relevant data, documents, or evidence that supports identified causes. This creates a comprehensive analysis package.
Maintain Version Control
Save different versions of your diagram as the analysis progresses. EdrawMax's cloud storage automatically tracks changes, allowing you to review the evolution of your analysis.
Integrate with Other Methodologies
Combine your fishbone diagram with other quality tools. EdrawMax supports various diagram types, allowing you to create connected analysis ecosystems.
Focus on Actionable Outcomes
Use EdrawMax's export and presentation features to convert your analysis into executive summaries, action plans, and implementation roadmaps.
Conclusion
The fishbone diagram remains one of the most powerful and enduring tools in problem-solving and quality management because it provides a structured approach to understanding complex problems. When implemented through EdrawMax, this methodology becomes significantly more effective, collaborative, and actionable.
EdrawMax transforms the traditional fishbone diagram from a static brainstorming artifact into a dynamic analysis tool that enhances team collaboration, supports comprehensive investigation, and facilitates the transition from analysis to implementation. The platform's intuitive interface, professional templates, and powerful features make sophisticated root cause analysis accessible to teams of all sizes and technical backgrounds.
Remember that the true value of any analytical tool lies in its ability to drive meaningful improvement. By combining the proven fishbone methodology with EdrawMax's modern digital capabilities, organizations can ensure their problem-solving efforts lead to sustainable solutions and continuous improvement.
FAQ
-
How to use a fishbone chart?
To use a fishbone diagram, define the problem as the "effect" at the head of the fish, then brainstorm categories of potential causes (e.g., People, Process, Equipment), and for each category, list specific contributing factors as branches off the main "spine". Use the diagram to analyze relationships and identify root causes. -
Is technical expertise required to use EdrawMax for fishbone diagrams?
No. EdrawMax is designed with an intuitive interface that requires no technical or design expertise. The drag-and-drop functionality, pre-made templates, and guided tools make it accessible to users of all skill levels. -
Can I integrate fishbone diagrams created in EdrawMax with other documentation?
Yes. EdrawMax supports export to multiple formats including PDF, PowerPoint, Word, and image files, allowing you to easily incorporate fishbone diagrams into reports, presentations, and other documentation.


