Fishbone Diagram Examples & Templates
Create Your Own Fishbone Diagram
EdrawMax is a powerful tool for diagramming and data visualization. This article explains everything you need to know about fishbone diagrams, from examples and templates to best practices. Get started for free today!
Fishbone diagrams are a valuable tool for teams to visualize complex problems and brainstorm solutions. They help you understand an issue by exploring it from different perspectives, connecting causes to the final effect. This structured approach allows you to identify the root causes of a problem.
Fishbone diagram templates are highly useful in various industries for presenting business data in a clear, compelling way. EdrawMax is a user-friendly tool for creating fishbone diagrams. With its smart objects, you can easily draw, edit, arrange, and connect various elements like shapes, lines, text, images, and colors to create a professional diagram.
1. What is a Fishbone Diagram?
A Fishbone diagram, also known as an Ishikawa Diagram (named after its creator, Kaoru Ishikawa) or a **cause-and-effect diagram**, is a visual tool that helps a team identify all the possible causes of a specific problem or outcome. By mapping out potential factors, it provides a comprehensive overview for effective problem-solving and analysis.
2. Free Fishbone Diagram Examples & Templates
A Fishbone diagram is a powerful tool for a clear analysis of problems by breaking them down into root causes. Edraw provides a wide variety of **fishbone diagram templates** that you can download and use for free!
Please note that the .eddx files require EdrawMax to be opened. If you don't have EdrawMax yet, you can download it for free!
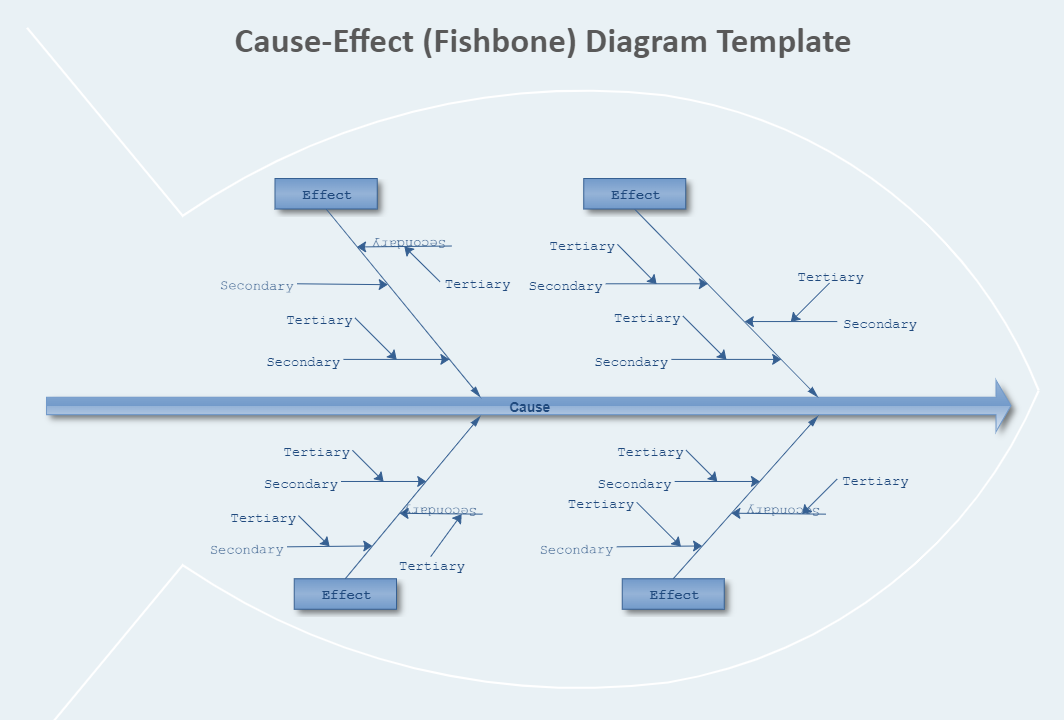
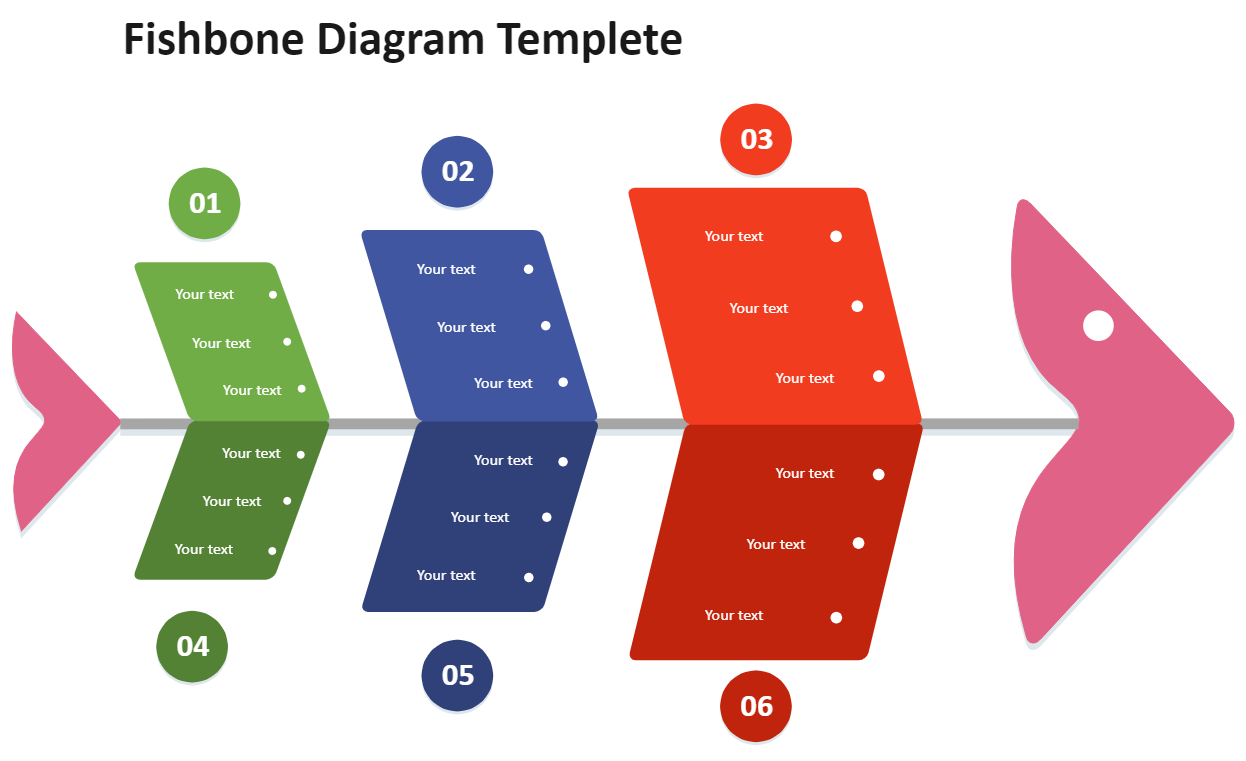
Example 1: Fishbone Diagram Template
This simple fishbone diagram template provides a perfect starting point for creating your own cause-and-effect analysis.
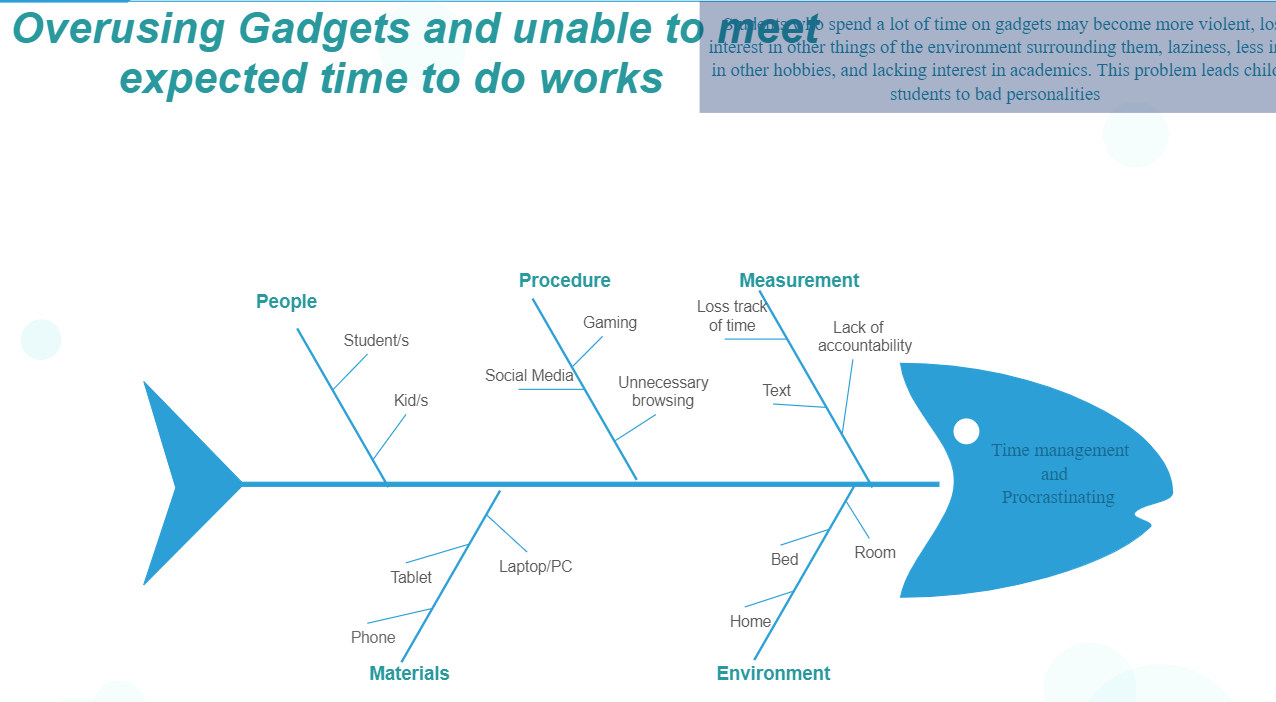
Example 2: Fishbone Diagram for Time Management
This example explores the effects of students' excessive cell phone use, a common issue in today's world. The diagram highlights how a dependence on technology can lead to poor time management and social isolation. It serves as a visual guide to identify the various contributing factors.
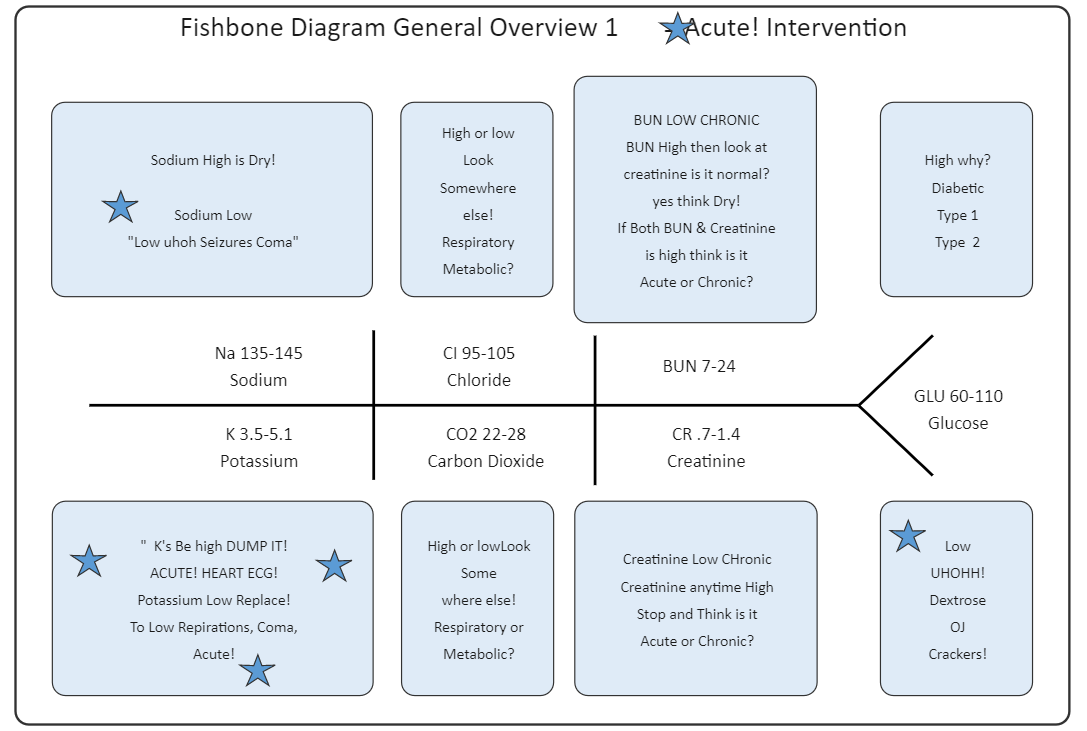
Example 3: Fishbone Diagram for Electrolytes
This fishbone diagram helps to visualize the probability of two different events occurring simultaneously, providing a clear way to understand complex relationships in fields like chemistry or medicine.
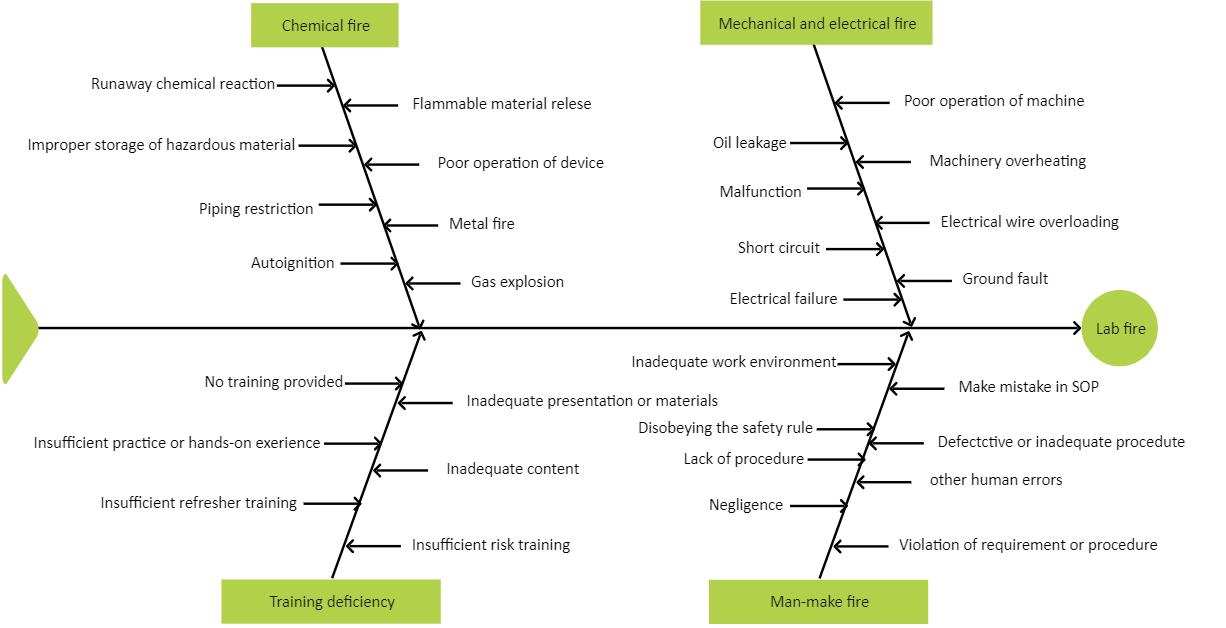
Example 4: Fishbone Diagram for Labs
When comparing products, a fishbone diagram can help you decide which features matter most. In this example, it helps analyze and compare a dog grooming tool and a food supplement to make a data-driven purchasing decision.
Example 5: Fishbone Diagram for Career Goals
A fishbone diagram is an insightful way to analyze your career. It helps you identify what you enjoy, what you dislike, and what you want to change, ultimately helping you create a more balanced and fulfilling work environment.
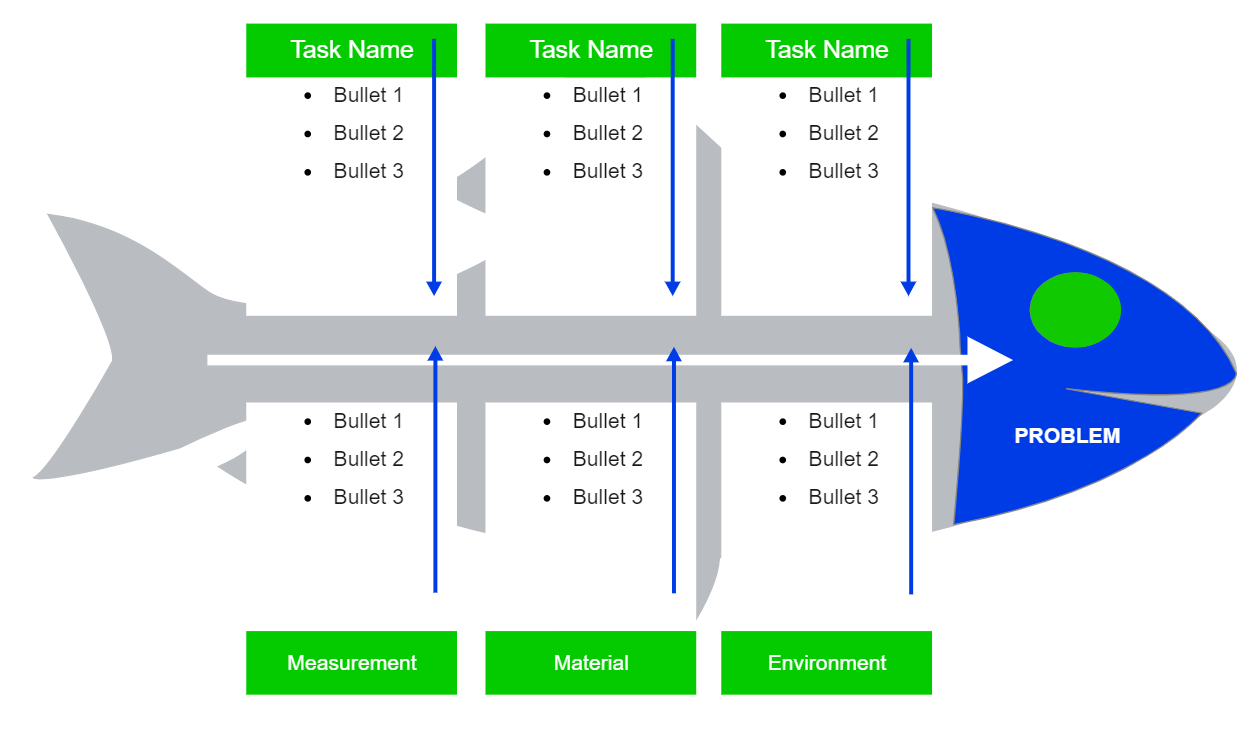
Example 6: Fillable Fishbone Diagram for Education
This fillable fishbone diagram can be used to analyze various aspects of education. It helps you compare different teaching and learning methods, identify similarities, and understand key differences, promoting a more effective learning environment.
Example 7: Fishbone Diagram for Productivity
This fishbone diagram is perfect for anyone looking to improve their productivity. It helps you analyze your goals and values to serve a niche that wants to solve a problem. It provides a clear framework to help customers become more effective and efficient.
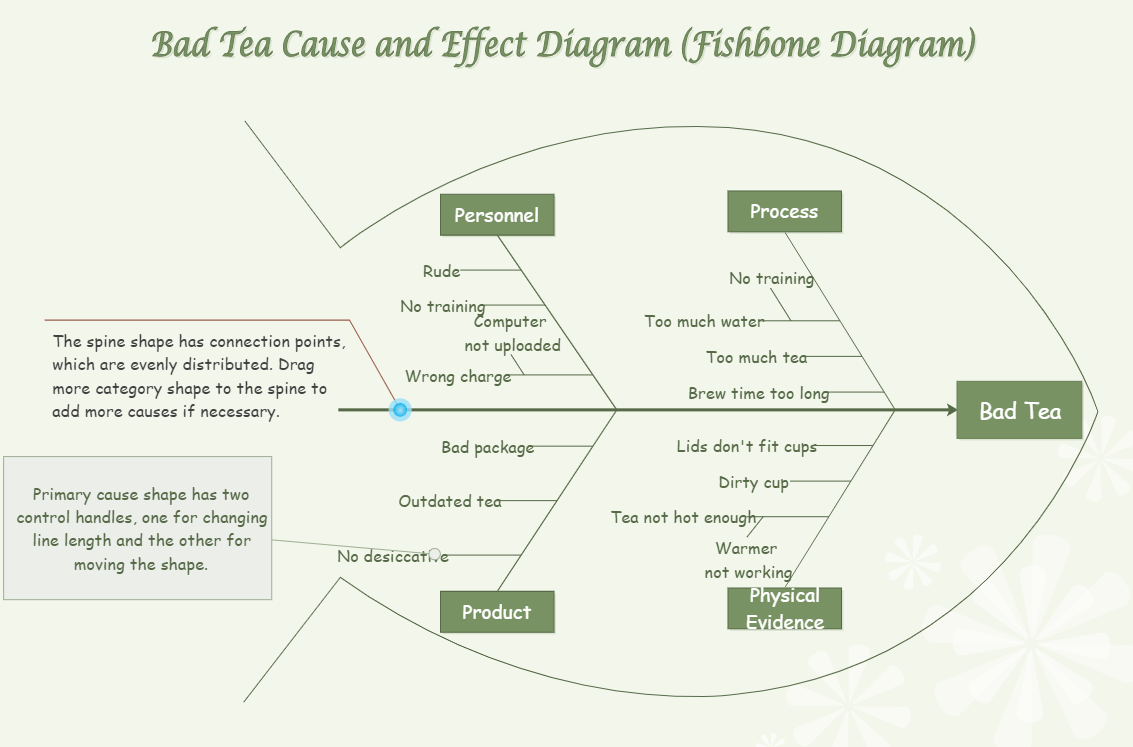
Example 8: Fishbone Diagram for Tea Quality
Fishbone diagrams are ideal for analyzing the causes of quality issues, such as a batch of bad tea. By mapping out potential factors like the process, ingredients, and environment, this diagram helps pinpoint the root cause of the problem. Using the online tool, you can visualize the entire process, physical evidence, and product description to quickly diagnose the issue.
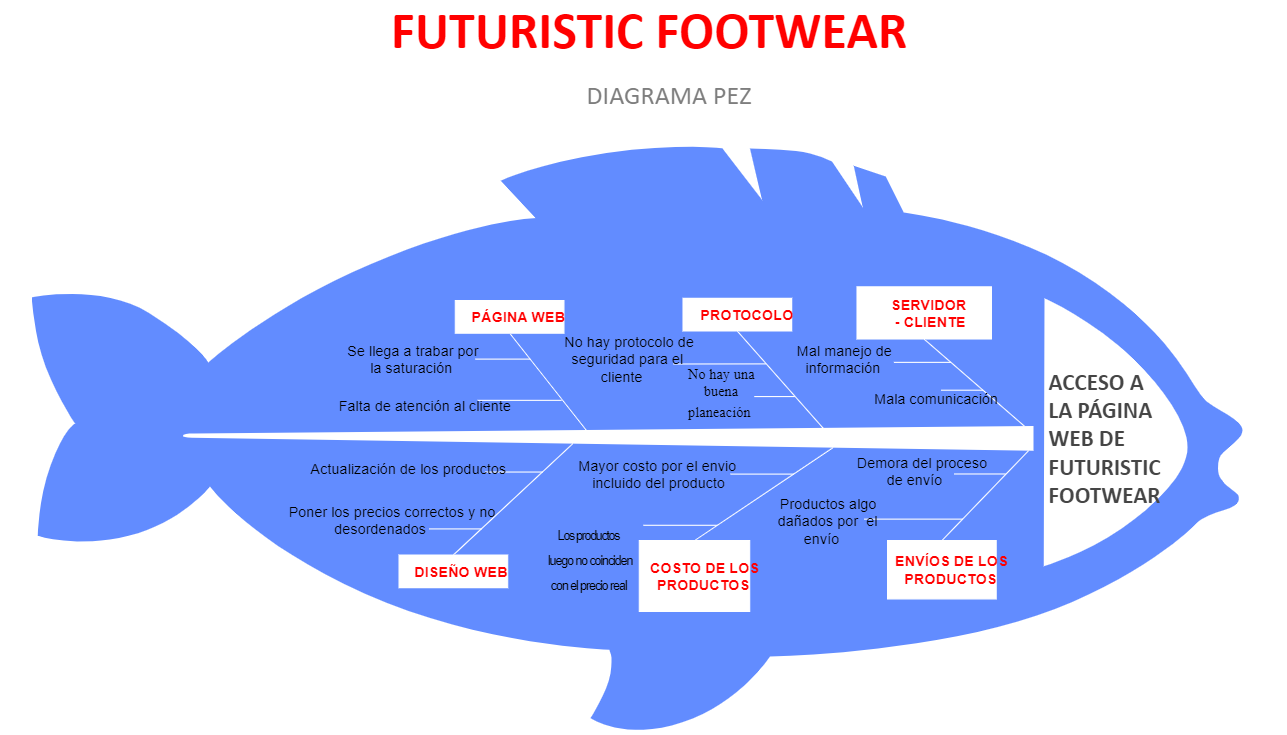
Example 9: Footwear Website Fishbone Diagram
This Fishbone Diagram provides a visual representation of how a company can increase its website visitors, which is considered a problem because if visitors are fewer, sales would be less. The diagram below shows us that there are many factors to attract website visitors and convert them to customers.
Example 10: Footwear Website Fishbone Diagram
A fishbone diagram is one tool to determine the causes and effects of various deviations, failures, or defects in the business. Business managers mostly use the Ishikawa diagram or the cause and effect diagram as a tool in finding out the deviations that are necessary to detect for business expansion. Learn more details from this diagram, or try to make yours with ease.
3. Usage and Benefits of a Fishbone Diagram
Fishbone diagrams are widely used as a business tool to identify the causes of a problem or event. Its main purpose is to find the root cause of an issue. When used properly, a fishbone diagram can help teams brainstorm and identify the possible causes for a problem. It can be used to help a team organize their thinking around a problem, such as: identifying the root cause of an issue; determining what caused an event; or exploring ways to prevent a problem from happening again.
Usage of Fishbone Diagrams
- ✓
To Identify Potential Causes: When you are looking for ways to improve something or find a solution to an issue, this is the first step you should take. This will help you find the root causes of the problem and prevent them from happening again.
- ✓
To Evaluate a Problem: This is another step you can take after you have found the potential causes of a problem. You can now use the Fishbone Diagram to evaluate the problem and find ways to fix it.
- ✓
To Prevent Problems: This is a great way to prevent problems from happening. If you have a list of all the potential causes and solutions to a problem, you will be able to prevent them from happening again.
Benefits of a Fishbone Diagram
- ✓
Easy to Use: Fishbone diagrams are easy to understand and use. You don't need any special knowledge or training to use them. You can use them for simple or complex problems.
- ✓
Interactive: They can be used to brainstorm ideas and solutions with a group. This makes the process interactive and fun.
- ✓
Effective: The diagrams can be used to identify the root cause of an issue. This can save you a lot of time and money in the long run.
4. How to Create a Fishbone Diagram
There are three simple ways to use a fishbone diagram:
Step 1: Choose a Fishbone Diagram Template
You can either create a fishbone diagram from scratch using EdrawMax or you can choose a pre-designed template that is available from the Templates Community. If you do not find the right template, you can go to the Template Community, where there are thousands of great templates from the user community.
Step 2: Add Main Categories
Fishbone diagrams are often organized into main categories. Some of the common categories for a fishbone diagram are 4Ps (Policy, Procedure, People, Plant) and 4Ss (Surroundings, Suppliers, Systems, Skills). Click on the shape and use the text tool to add the main categories. You can also add other categories according to your needs.
Step 3: Add Causes to the Diagram
Add the possible causes and sub-causes to the categories you created. Once you have a list of causes, you can sort them into categories. Each cause and sub-cause should be connected to the main branch of the fishbone diagram.
5. Free Fishbone Diagram Creator
A fishbone diagram is a great way to brainstorm and find the root cause of a problem. If you need to create a fishbone diagram, then you should consider using EdrawMax. It's a great tool that comes with many features. This software has a built-in gallery of templates, which you can use for free. The software is available for Windows, Mac, and Linux, and you can even use it online. If you are a new user, you can also download EdrawMax and try it for free.
6. Final Thoughts
A fishbone diagram is one of the best tools for cause-and-effect analysis. It is an ideal tool for any business that wants to identify and solve problems. It can be used by any business, regardless of the size. With EdrawMax, you can easily create beautiful fishbone diagrams for any business or personal use. Just try it now!
Ready to Create Your Fishbone Diagram?
EdrawMax is an all-in-one diagramming tool that helps you create more than 280 types of diagrams with ease. You can use built-in templates and symbols to create your diagrams and share them with others easily. Try it for free now!
You May Also Like


