What is a Physical Map?
Complete Guide to Understanding Physical Maps
Physical maps are essential tools commonly encountered in geography classes and travel planning. They utilize color gradients to represent elevation changes, clearly displaying the topography of geographical areas. Continue reading to gain comprehensive knowledge about physical maps and their applications.
A physical map accurately represents and displays the natural physical features of a terrain in two-dimensional format. These maps are specifically designed to make Earth's natural landscape features clearly visible and easily interpretable. Color gradients and detailed keys provide essential context to enhance the map's readability and informational value.
Physical maps comprehensively replicate visual terrain information, clearly displaying topographical features even in two-dimensional format. Through strategic color usage and specialized keys, physical maps serve as the optimal resource for terrain understanding when using paper maps. Additionally, these maps highlight elevation variations, important borders, water bodies, and desert regions, making them invaluable for geological studies and geographical analysis.
EdrawMax Map Software enables creation of interactive map drawings with easy-to-edit templates. Simplify navigation and enhance your travel experience.
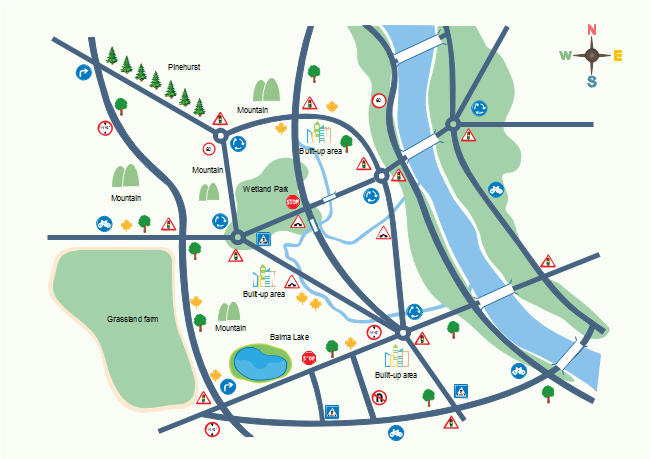
Physical maps display geographical features, making them ideal for identifying deserts, plains, mountains, and water bodies. When traveling and needing comprehensive terrain knowledge, physical maps provide essential information.
Enhanced physical map versions may also display rainfall patterns and temperature data. These specialized maps enable various calculations and help identify ideal destinations based on preferred weather conditions.
Related Resource: How to Use Weather Clipart
Physical maps include a key that enables proper interpretation and understanding of the presented information.
Standard physical maps position keys horizontally at the bottom or vertically along the sides. The crucial step involves understanding symbol meanings and representations.
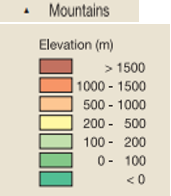
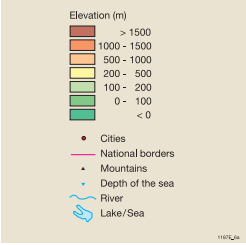
Elevation representation forms the most critical aspect of physical maps. Colors differentiate altitude variations, with spectra progressing from blue to bright red as elevation increases. Bright red typically indicates elevations above 1500m, often marked with upward-pointing black arrows accompanied by numerical height values.

National borders are typically shown with red lines (with alternative colors indicated in the key when used). City names are commonly displayed in pink coloration.

Rivers appear as simple lines emphasizing surrounding land features, while lakes and seas are shown at larger scales. Oceans and seas often feature downward-pointing blue arrows with negative numerical values indicating water depth measurements.

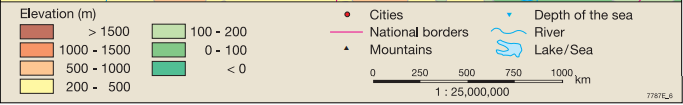
Scale represents one of the most vital map components, enabling distance measurements. Since exact real-world distances cannot be replicated on maps, scales facilitate real-life size calculations. In this example, 1 cm on the map equals 25,000,000 (25 million) centimeters in reality.
Understanding these key elements enables effective interpretation and utilization of physical maps.
This world physical map clearly displays diverse topographical features through strategic color usage. The key appears in the bottom left corner, while the scale is positioned in the bottom right. While not all features are highlighted, major mountains and their elevations are prominently displayed. World physical maps provide overall geographical perspectives rather than detailed feature highlighting for specific areas.
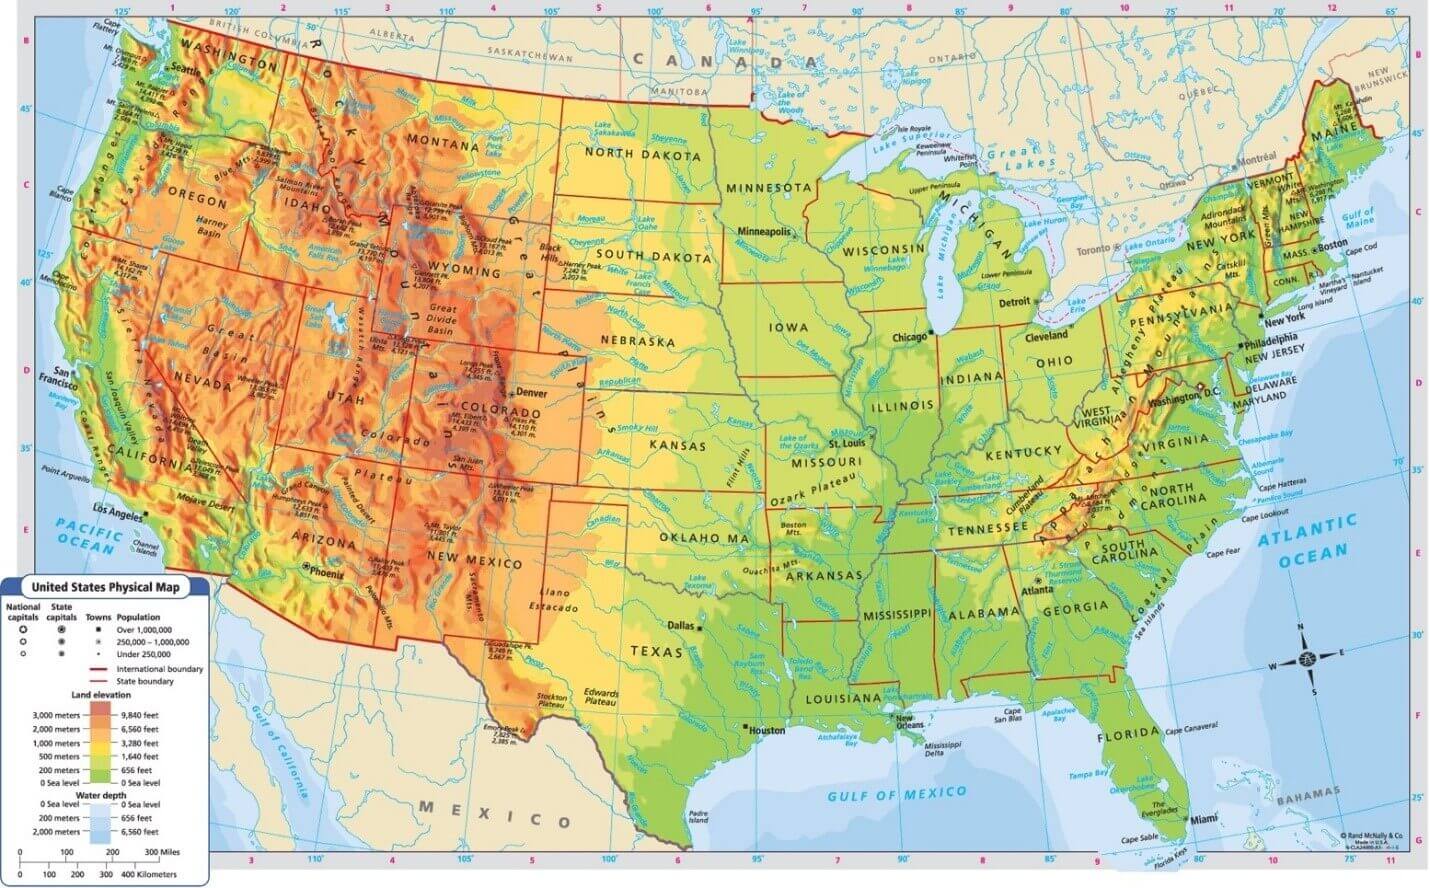
This physical map demonstrates efficient topographical feature outlining with a detailed key in the bottom left corner showing numerous included features. Water body depths are differentiated through blue shading variations, and significant elevations are recorded throughout. State boundaries remain clearly visible, demonstrating how focused area maps can include extensive detail.
These examples illustrate the varying detail levels in physical maps, with more specific areas allowing greater feature identification and documentation.
Physical maps remain essential tools for geographical studies and analysis. In the absence of three-dimensional representations, these two-dimensional maps effectively visualize terrain features. They form the foundation for political map creation and provide invaluable resources for topographical understanding, particularly for geologists, pilots, and geographical professionals.