Algorithm Flowcharts Examples
Ready to Create Professional Algorithm Flowcharts?
EdrawMax specializes in professional diagramming and visualization. Discover everything about algorithm flowchart examples and templates in this comprehensive guide and learn how to implement them effectively. Start your free trial today!
Algorithms and flowcharts represent two distinct approaches to problem-solving processes. Algorithms provide step-by-step procedures for solving specific problems, while flowcharts visually represent these steps using standardized shapes and directional arrows. This visual representation makes flowcharts particularly effective for presenting algorithms. EdrawMax presents comprehensive algorithm flowchart examples to demonstrate this powerful combination.
1. Essential Rules for Drawing Algorithm Flowcharts
Flowcharts utilize standardized symbols and shapes that carry specific meanings within the diagram. These visual elements transform complex processes into easily understandable visual representations.
Common flowchart symbols include rectangles representing operational steps, parallelograms indicating data input/output, terminal points shown as cylinders, and diamonds symbolizing decision points. Explore more about flowchart symbols and their applications.
Effective flowchart creation requires both symbol knowledge and critical thinking. Consider these fundamental rules when designing your algorithm flowcharts:
- Connect all flowchart elements with clear arrows to maintain logical sequence and ensure easy navigation
- Maintain consistent flow direction (either left-to-right or top-to-bottom) to prevent ambiguity
- Begin every chart with a Start symbol and conclude with a single Terminal symbol with one associated flow line
- Maintain visual consistency across all shapes, symbols, and connecting lines, optionally including a symbol key for clarity
2. Free Algorithm Flowchart Examples & Templates
Explore our comprehensive collection of algorithm flowchart examples designed for various applications. Use the table of contents to navigate to specific examples.
Click the to download and use your preferred templates. EDDX files require EdrawMax for opening. Don't have EdrawMax yet? Download EdrawMax for free!


Comprehensive Examples List
- Calculate the Sum of Two Input Numbers
- Determine the Largest Number Among Multiple Integers
- Solve Quadratic Equation ax² +bx+c=0 Roots
- Generate Fibonacci Series Up to Term ≤ 1000
- Compute the Sum of the First 50 Numbers
- Identify Largest Price Among 100 Values and Apply 10% Discount
- Arrange Three Numbers in Descending Order
- Calculate Highest Common Factor (HCF) of Two Integers
- Determine Number Parity (Even/Odd)
- Calculate Bank Deposit Interest
- Determine Temperature Relative to Freezing Point
- Evaluate Student Exam Performance (Pass/Fail)
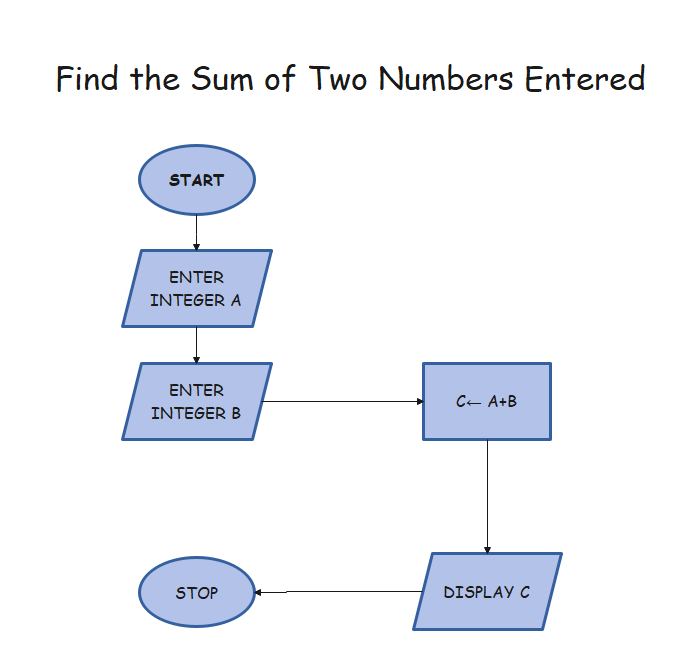
Example 1: Calculate the Sum of Two Input Numbers
- Step 1: Read Integer A
- Step 2: Read Integer B
- Step 3: Execute addition operation: C = A + B
- Step 4: Output Result C
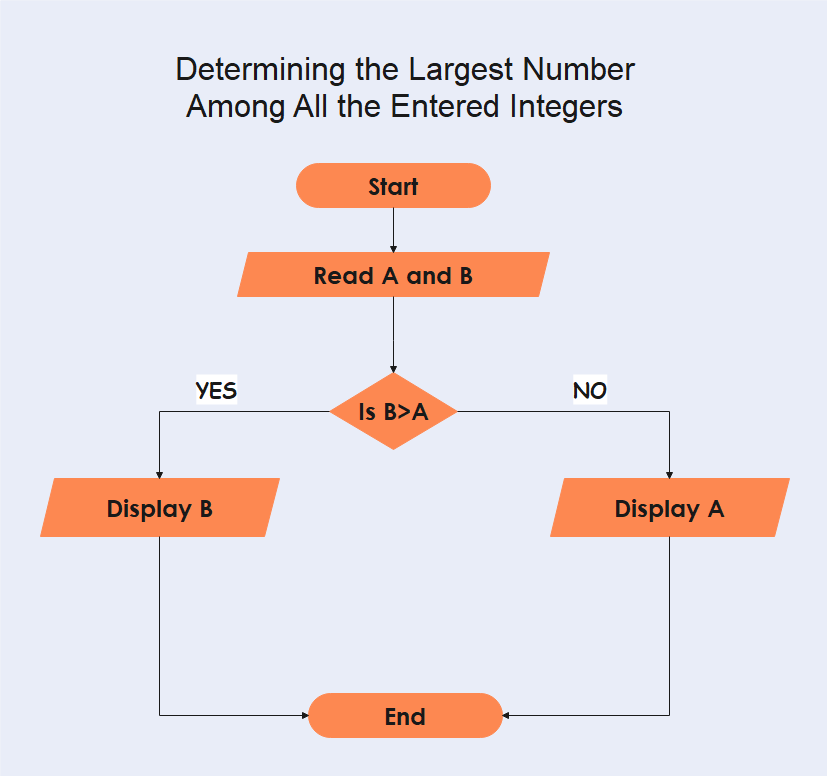
Example 2: Determine the Largest Number Among Multiple Integers
- Step 1: Read Integer A
- Step 2: Read Integer B
- Step 3: Compare values - if B > A, output B; otherwise output A
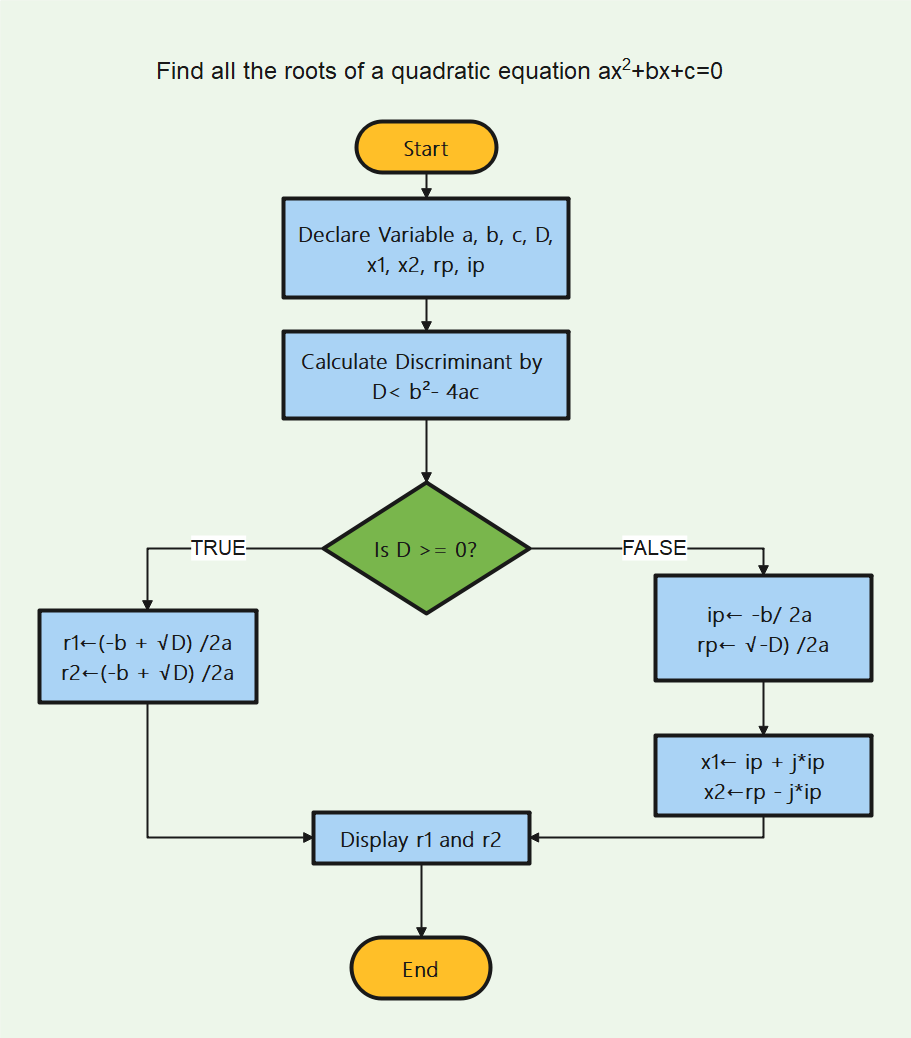
Example 3: Solve Quadratic Equation ax² +bx+c=0 Roots
- Step 1: Input variables a, b, c, D, x1, x2, rp, and ip
- Step 2: Calculate discriminant using formula: D = b² - 4ac
- Step 3: Output real and imaginary parts (rp and ip)
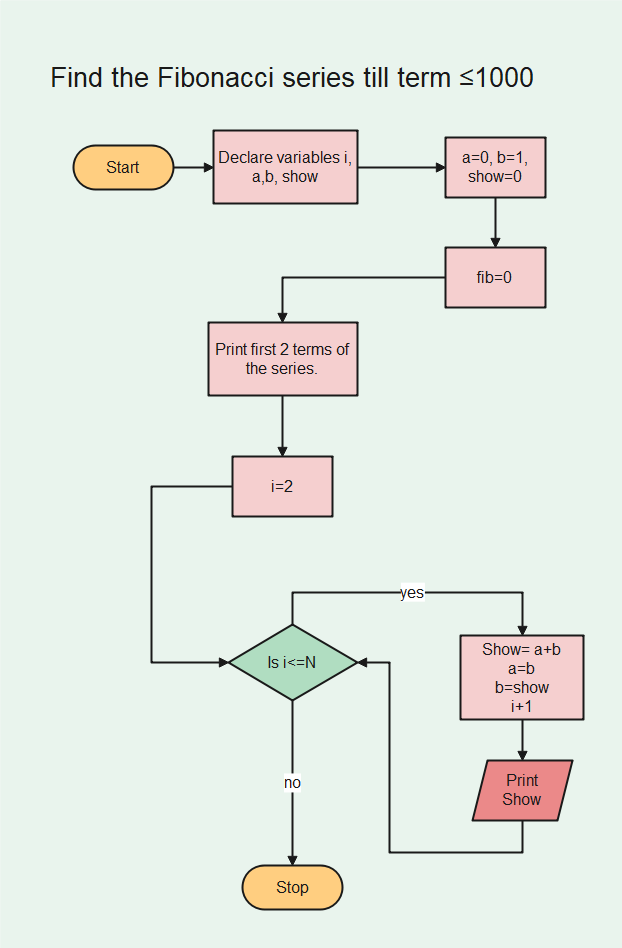
Example 4: Generate Fibonacci Series Up to Term ≤ 1000
- Step 1: Declare variables i, a, b, show
- Step 2: Initialize variables: a=0, b=1, show=0
- Step 3: Set maximum term limit: i=1000
- Step 4: Print initial two terms of series
- Step 5: Implement loop structure:
- Calculate next term: show = a + b
- Update values: a = b, b = show
- Increment counter: i = i + 1
- Output current term: Print show
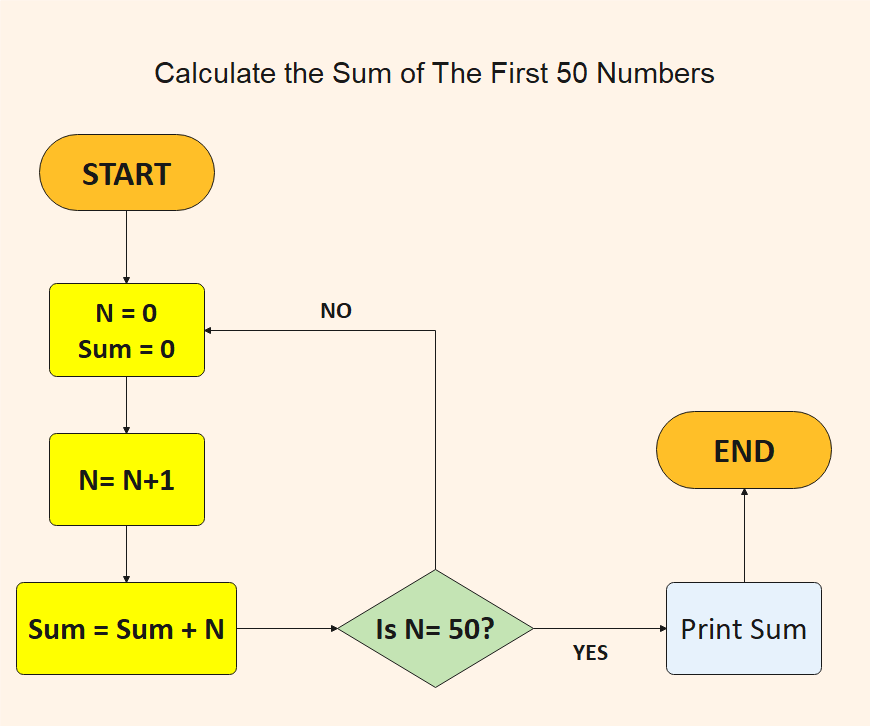
Example 5: Compute the Sum of the First 50 Numbers
- Step 1: Initialize variables: N=0, sum=0
- Step 2: Increment counter: N = N + 1
- Step 3: Accumulate sum: Sum = N + Sum
- Step 4: Repeat steps 2-3 until N=50
- Step 5: Output final sum
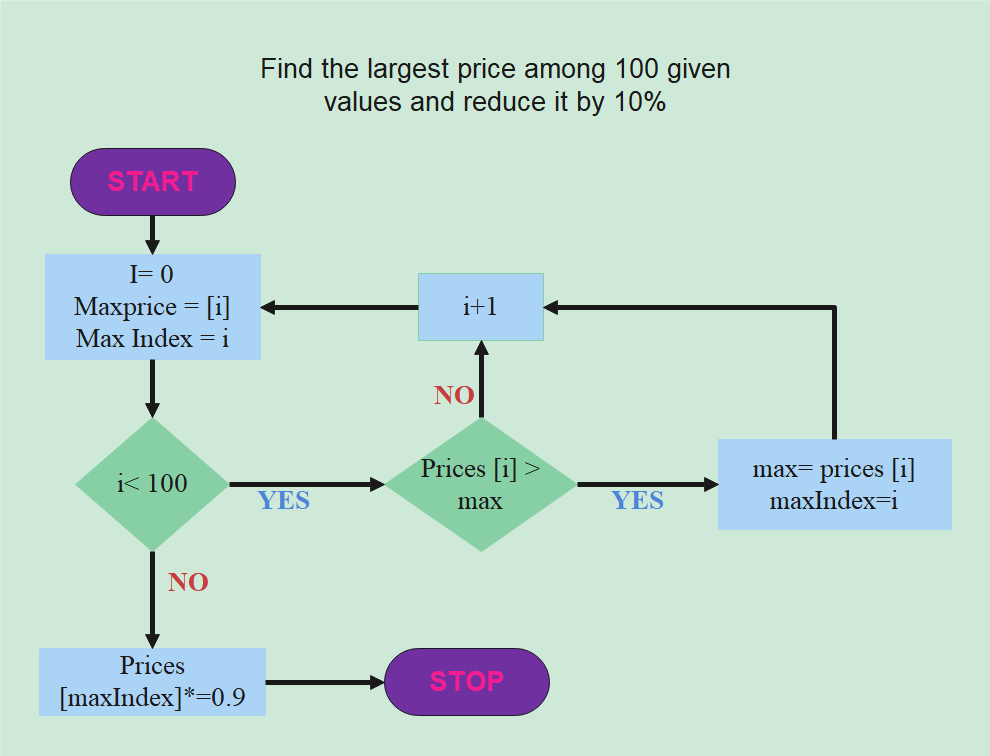
Example 6: Identify Largest Price Among 100 Values and Apply 10% Discount
- Step 1: Input 100 price values
- Step 2: Compare initial prices, storing greater value as 'max' with 'max index'
- Step 3: Iterate through all prices to identify maximum value
- Step 4: Apply discount: prices[max index] = prices[max index] × 0.9
- Step 5: Output modified price list
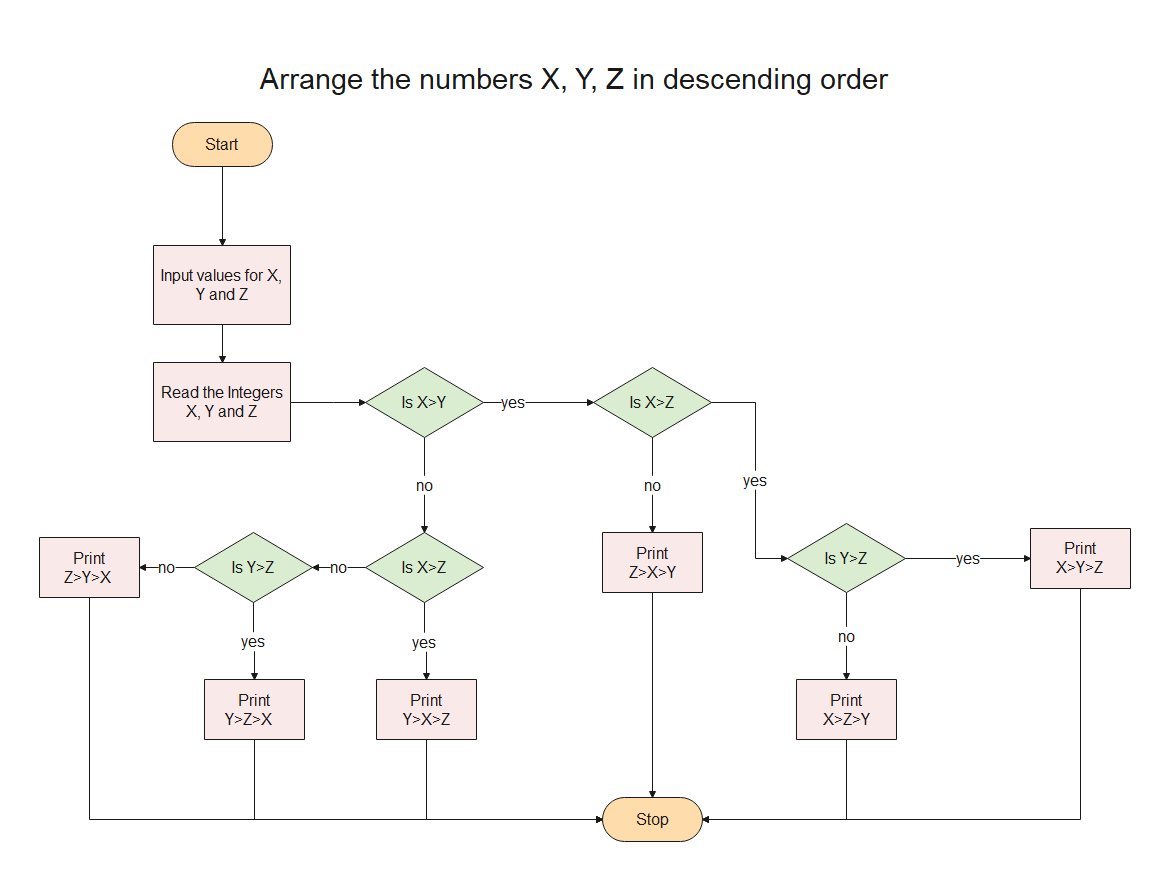
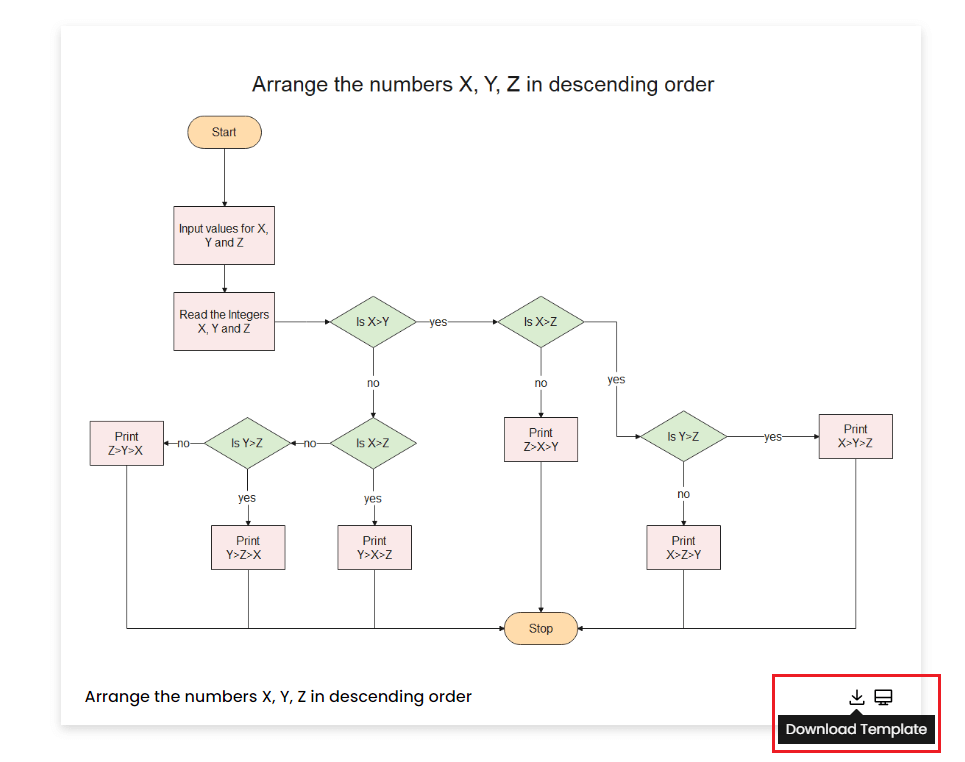
Example 7: Arrange Three Numbers in Descending Order
- Step 1: Input values for variables X, Y, Z
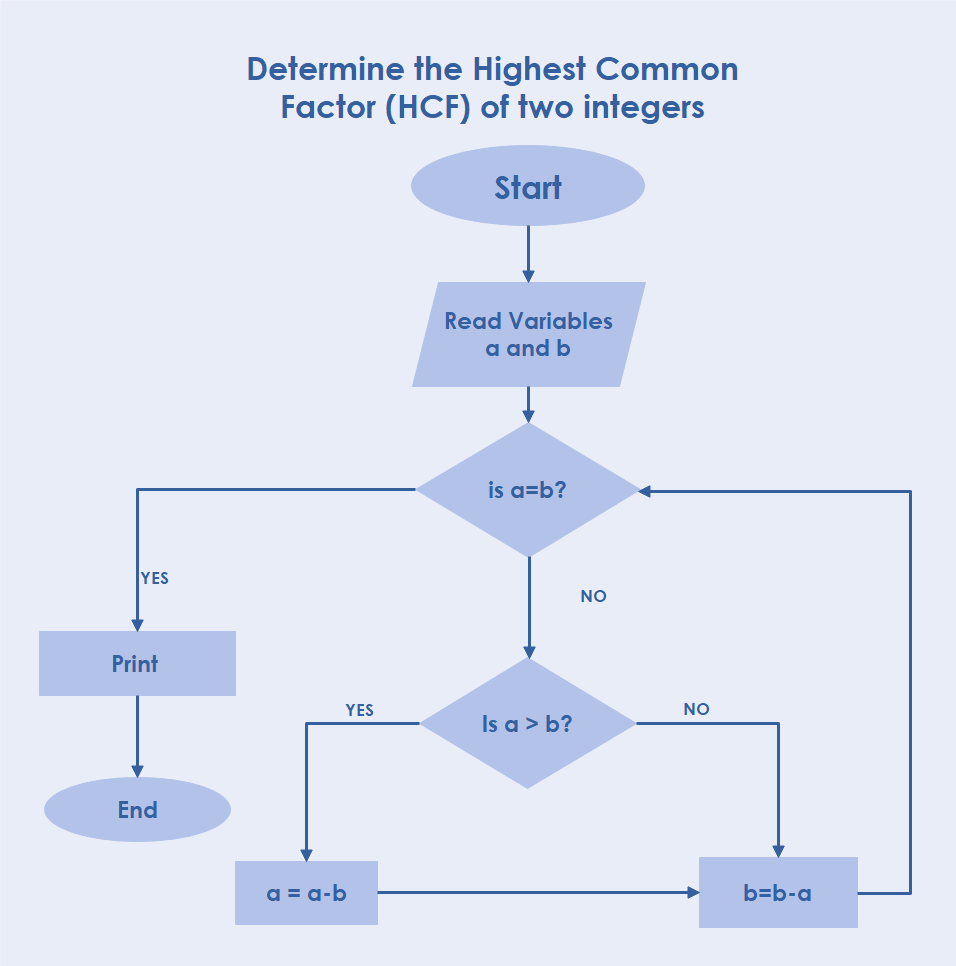
Example 8: Calculate Highest Common Factor (HCF) of Two Integers
- Step 1: Read variables a and b
- Step 2: If a = b, proceed to step 4
- Step 3: If a > b, execute: a = a - b. Return to step 2
- Step 4: Output result (a or b)
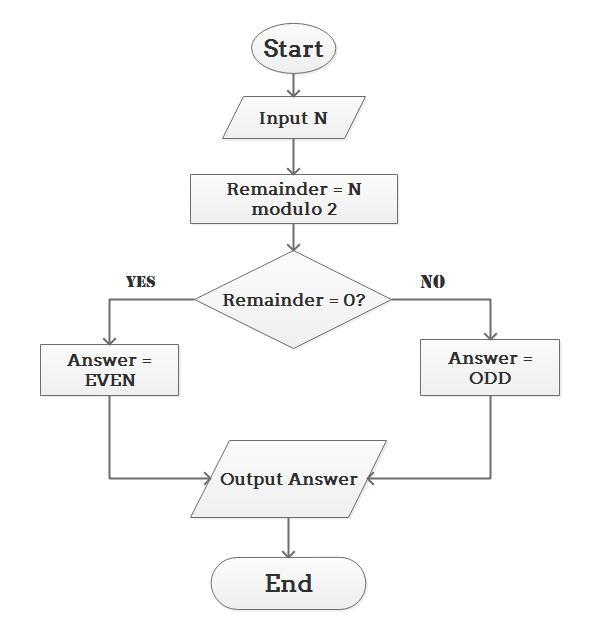
Example 9: Determine Number Parity (Even/Odd)
- Step 1: Read number N
- Step 2: Calculate remainder: N modulo 2
- Step 3: If remainder equals 0, N is even; otherwise N is odd
- Step 4: Output classification result
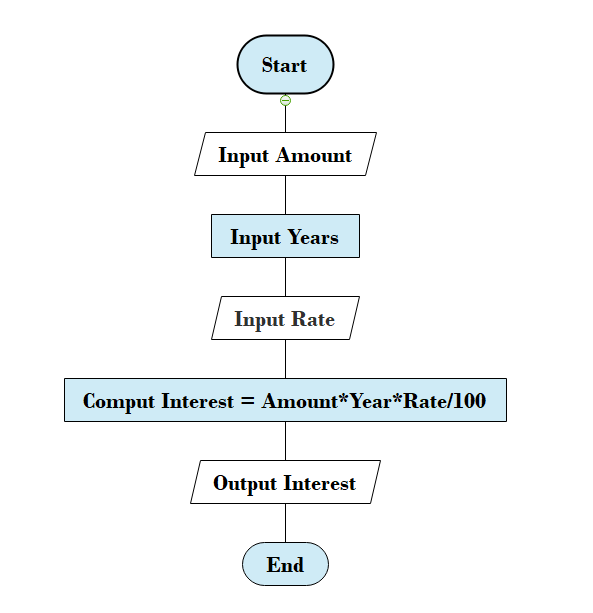
Example 10: Calculate Bank Deposit Interest
- Step 1: Read deposit amount
- Step 2: Read investment years
- Step 3: Read interest rate
- Step 4: Calculate interest: Interest = Amount × Years × Rate / 100
- Step 5: Output calculated interest
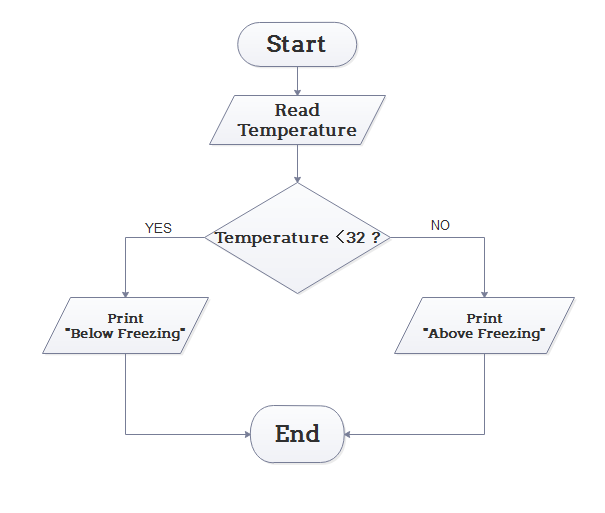
Example 11: Determine Temperature Relative to Freezing Point
- Step 1: Input temperature value
- Step 2: If temperature < 32, output "below freezing point"; otherwise output "above freezing point"
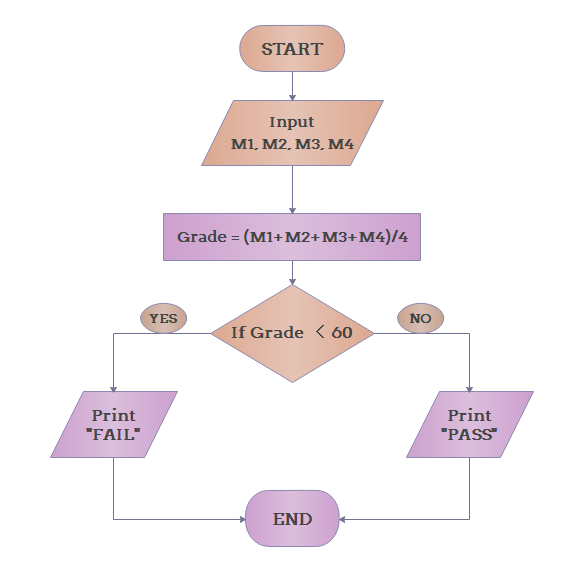
Example 12: Evaluate Student Exam Performance (Pass/Fail)
- Step 1: Input grades for four courses: M1, M2, M3, M4
- Step 2: Calculate average grade: Grade = (M1 + M2 + M3 + M4) / 4
- Step 3: If average grade < 60, output "FAIL"; otherwise output "PASS"
3. How to Create an Algorithm Flowchart
EdrawMax is vector-based diagramming software offering extensive templates for algorithm flowchart creation. Its intuitive interface enables efficient diagramming, allowing users to customize existing templates or create original designs. With 26,000+ specialized symbols, EdrawMax provides comprehensive tools for algorithm flowchart development. Explore detailed algorithm flowchart creation in this comprehensive algorithm flowchart guide.
Step 1 Install EdrawMax
Edit templates directly from this page by clicking any template, or download EdrawMax for full functionality.
Step 2 Download Template
After installation, download templates by clicking the download icon or access EdrawMax's built-in template library directly from the desktop application.
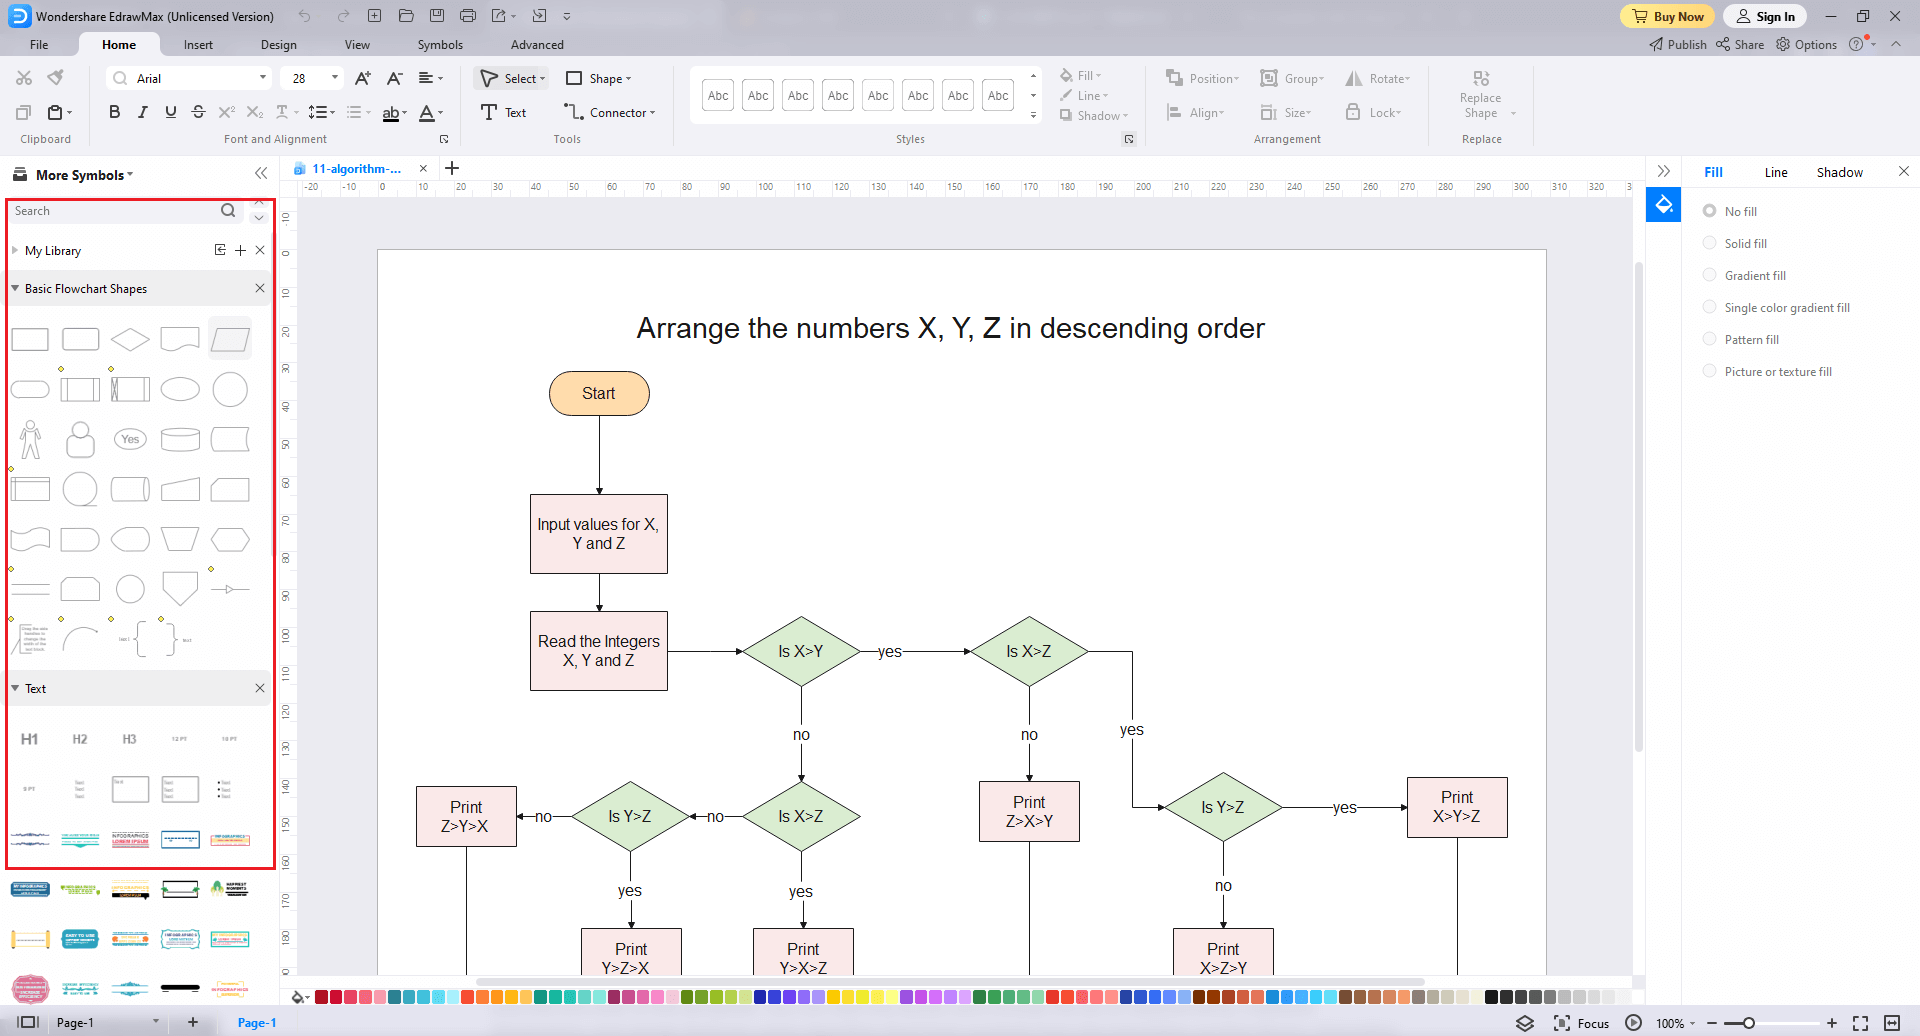
Step 3 Open Template
Open downloaded templates by double-clicking or through EdrawMax's file navigation. Access essential symbols through the 'Symbols' section by importing 'Algorithm Flowchart' symbol sets.
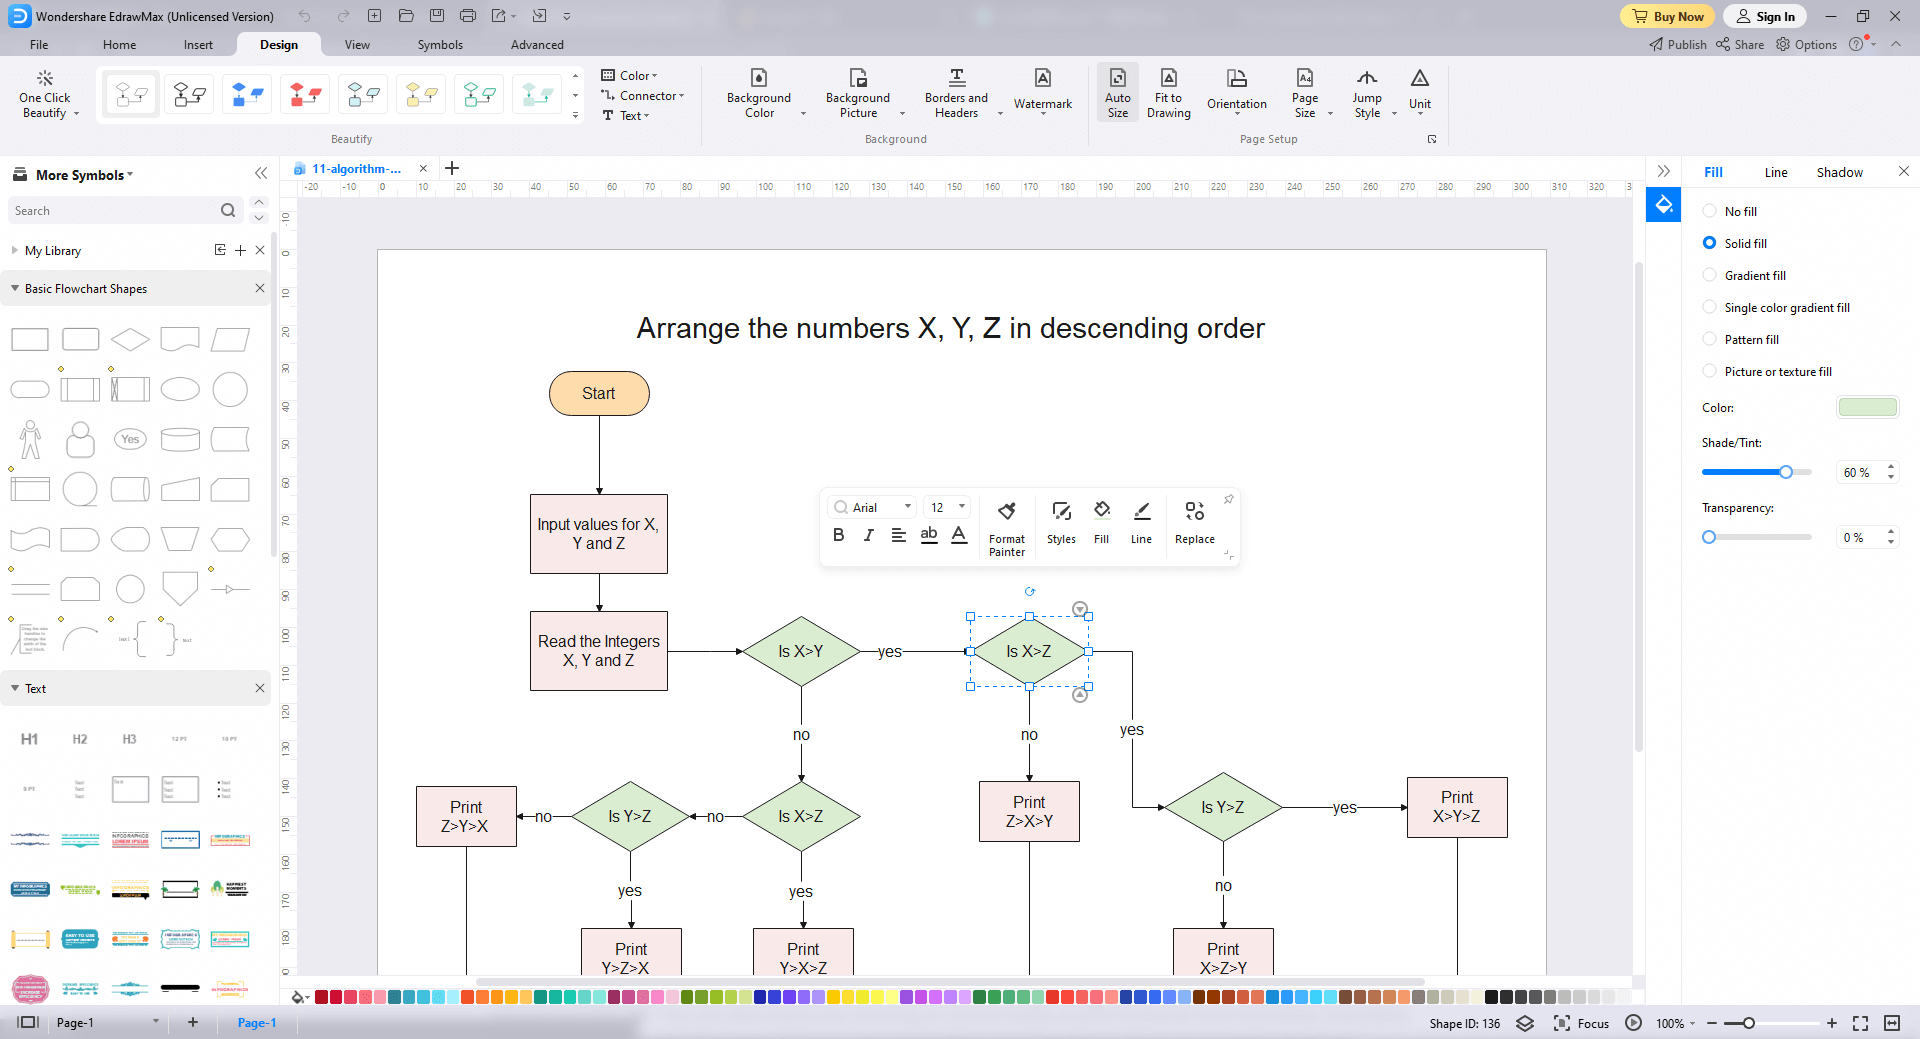
Step 4 Customize Template
Utilize EdrawMax's comprehensive diagramming tools to customize your algorithm flowchart. Modify colors, fonts, and layouts while incorporating requirements and dimensions using 26,000+ professional symbols through intuitive drag-and-drop functionality.
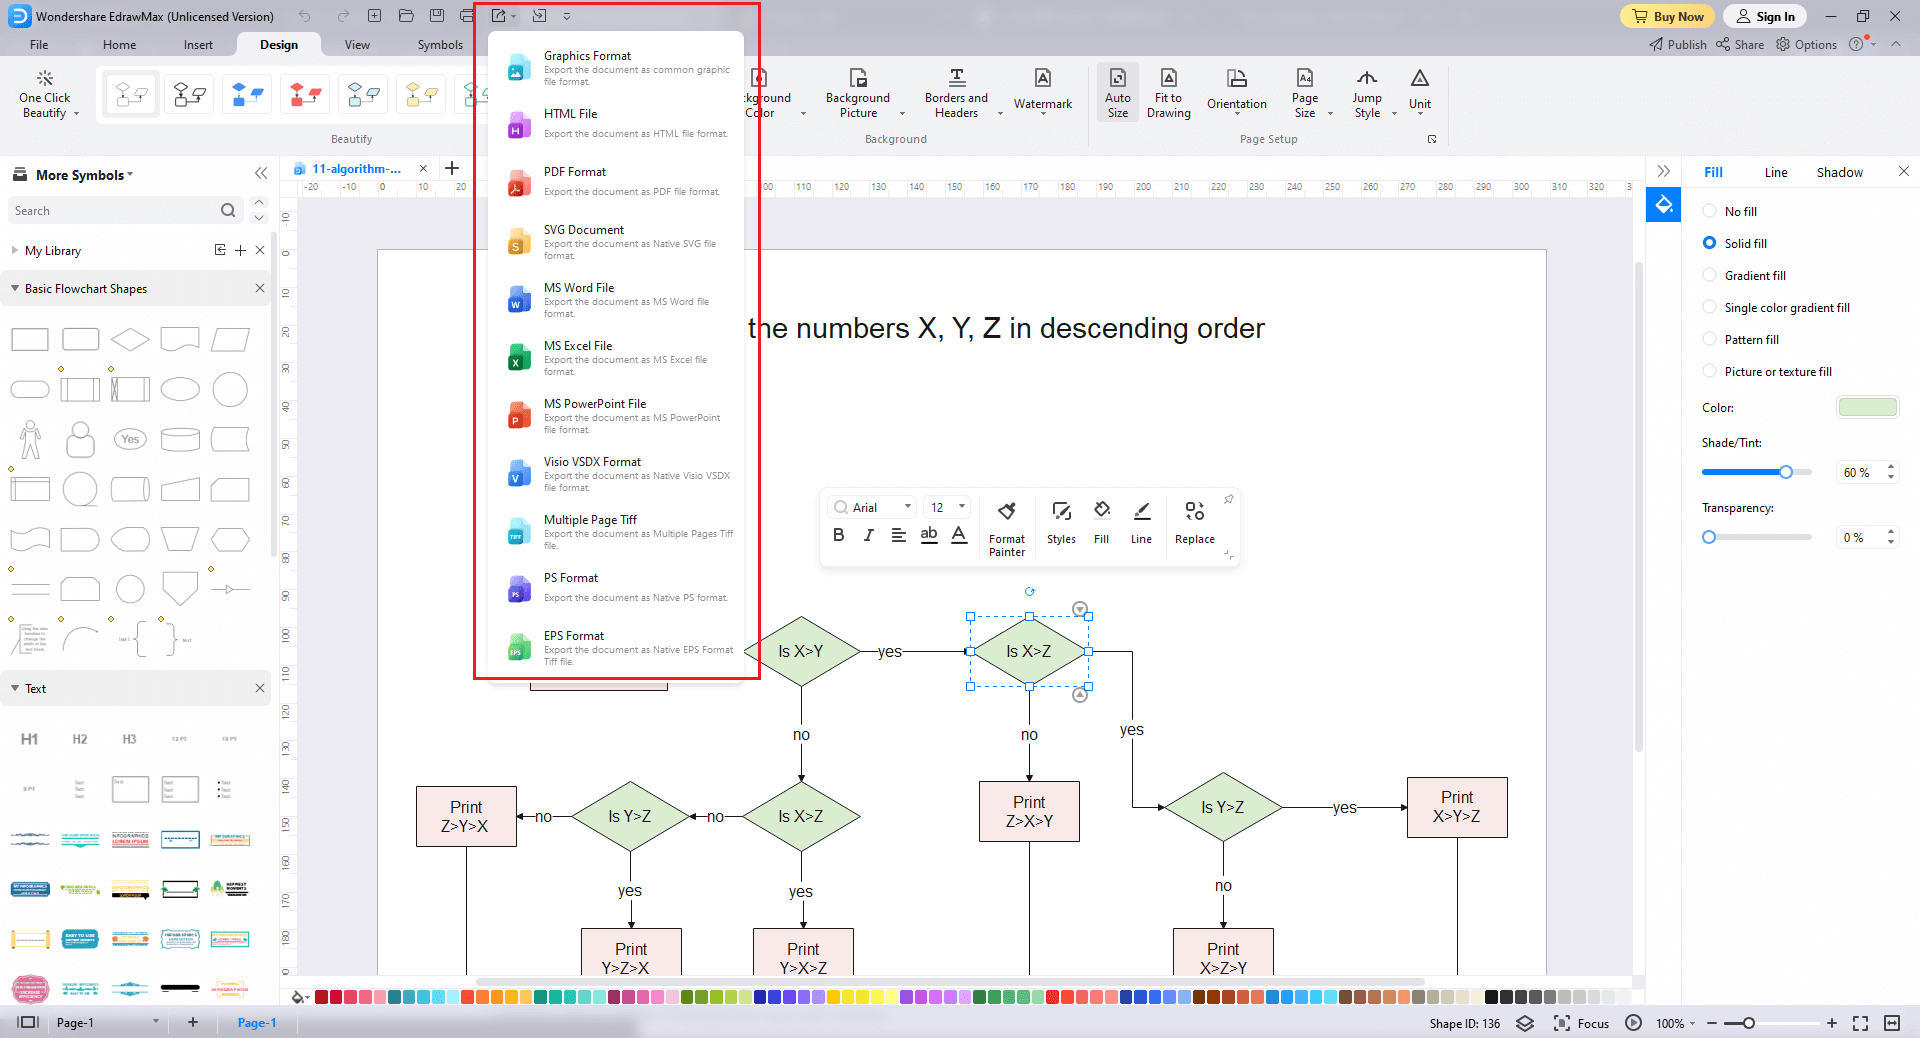
Step 5 Save or Export
After completing your algorithm flowchart, export it in multiple formats including Microsoft Office, PDF, HTML, Visio, and graphics. Access export options through the 'File' menu or share directly on social media platforms. Utilize presentation mode for team demonstrations.
4. Free Algorithm Flowchart Software
EdrawMax stands as the premier free algorithm flowchart software, featuring an extensive template library that can be customized to specific requirements. This powerful tool enhances strategic development through professional flowchart creation, utilizing shapes, arrows, and connecting lines without diagram quantity limitations.
- EdrawMax provides easily customizable templates with multiple relationship and process flow options
- Professionals prefer EdrawMax for its intuitive interface and robust collaboration features
- Built-in sharing functionality facilitates seamless team collaboration
- User-friendly dashboard and drag-and-drop features make it ideal for beginners and experts alike
- Supports export/import across multiple formats including MS Office, Graphics, PDF, HTML, and Visio
- Enterprise-grade encryption ensures maximum data security for all your algorithm flowcharts
5. Final Thoughts
Flowcharts provide invaluable visual representations for understanding complex processes and their requirements. These graphical tools effectively connect various elements and decision points, enhancing process comprehension.
EdrawMax delivers exceptional software for creating professional flowcharts and diagrams rapidly. Its comprehensive toolset and extensive symbol library streamline the diagramming process, enabling creation of both simple and complex diagrams with remarkable efficiency. Experience EdrawMax to produce professional-grade drawings with effortless precision.

Complete Flowchart Guide
Explore our comprehensive guide covering flowchart types, symbols, and creation techniques for effective visual process representation.
You May Also Like


