8 Types of Thinking Maps: A Comprehensive Guide With Examples

A thinking map is a powerful learning methodology that visualizes abstract thoughts and mental processes through concrete visual representations. This approach enables learners to organize ideas and information more effectively while enhancing comprehension through visual connections.
Thinking maps facilitate connections between information points, making complex relationships easier to understand. These tools are particularly valuable during creative and analytical thinking processes. In educational settings, teachers across primary and secondary schools frequently utilize thinking maps to enhance instructional delivery and student understanding.
There are eight distinct types of thinking maps, each designed for specific cognitive purposes and requiring different logical approaches. All thinking maps can be creatively combined to address complex thinking challenges.
1: Circle Map – Brainstorming and Defining
A circle map provides an effective framework for exploring topics through individual or group brainstorming sessions. The map features two concentric circles: the inner circle contains the main topic or central idea, while the larger surrounding circle captures related concepts, definitions, and associations.
This map type is ideal for initial idea generation and conceptual exploration before developing more complex plans. For example, when exploring "IG stories" as a central topic, participants can document related thoughts and questions in the outer circle. This structured brainstorming approach makes the circle map particularly valuable for gathering and retaining information during the initial stages of any subject exploration.
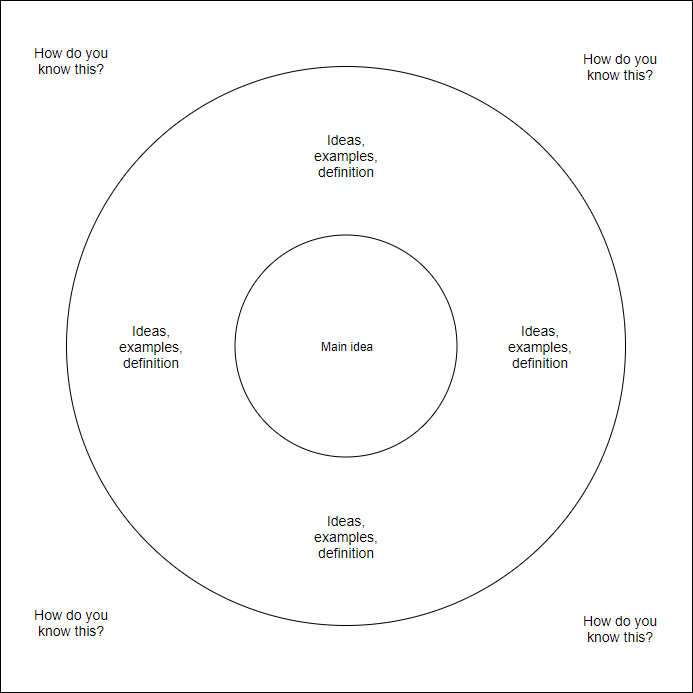
Image source: online.visual-paradigm.com
2: Bubble Map – Describing with Attributes
Bubble maps enable detailed subject description through adjective-based characterization. This approach encourages deeper thinking about specific topics, making it ideal for students to identify and summarize relevant attributes for subjects like animals or literary characters.
Beyond descriptive applications, bubble maps excel at goal setting and objective breakdown. The map structure allows users to deconstruct larger goals into manageable components, creating a clear pathway toward achievement. For instance, annual goals can be divided into six specific sub-goals, each providing focused direction and measurable milestones.
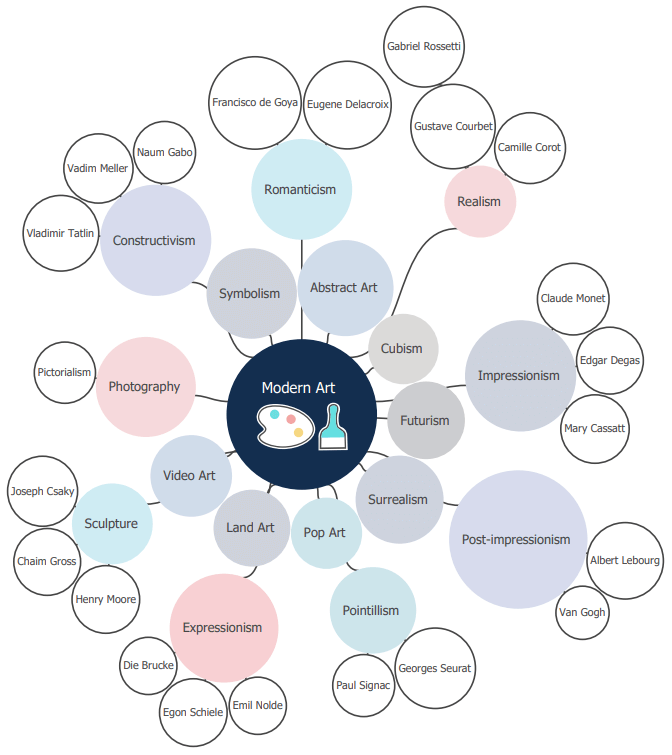
Image source: edrawsoft.com
3: Flow Map – Sequencing and Processes
Flow maps excel at visualizing processes, progressions, and sequences. Information and procedural steps can be clearly labeled and organized to show logical progression and relationships.
These maps also serve practical wayfinding purposes, guiding people through physical spaces or procedural steps. In educational settings, flow maps can direct parents and students through registration processes during school open days, ensuring smooth navigation through complex procedures.
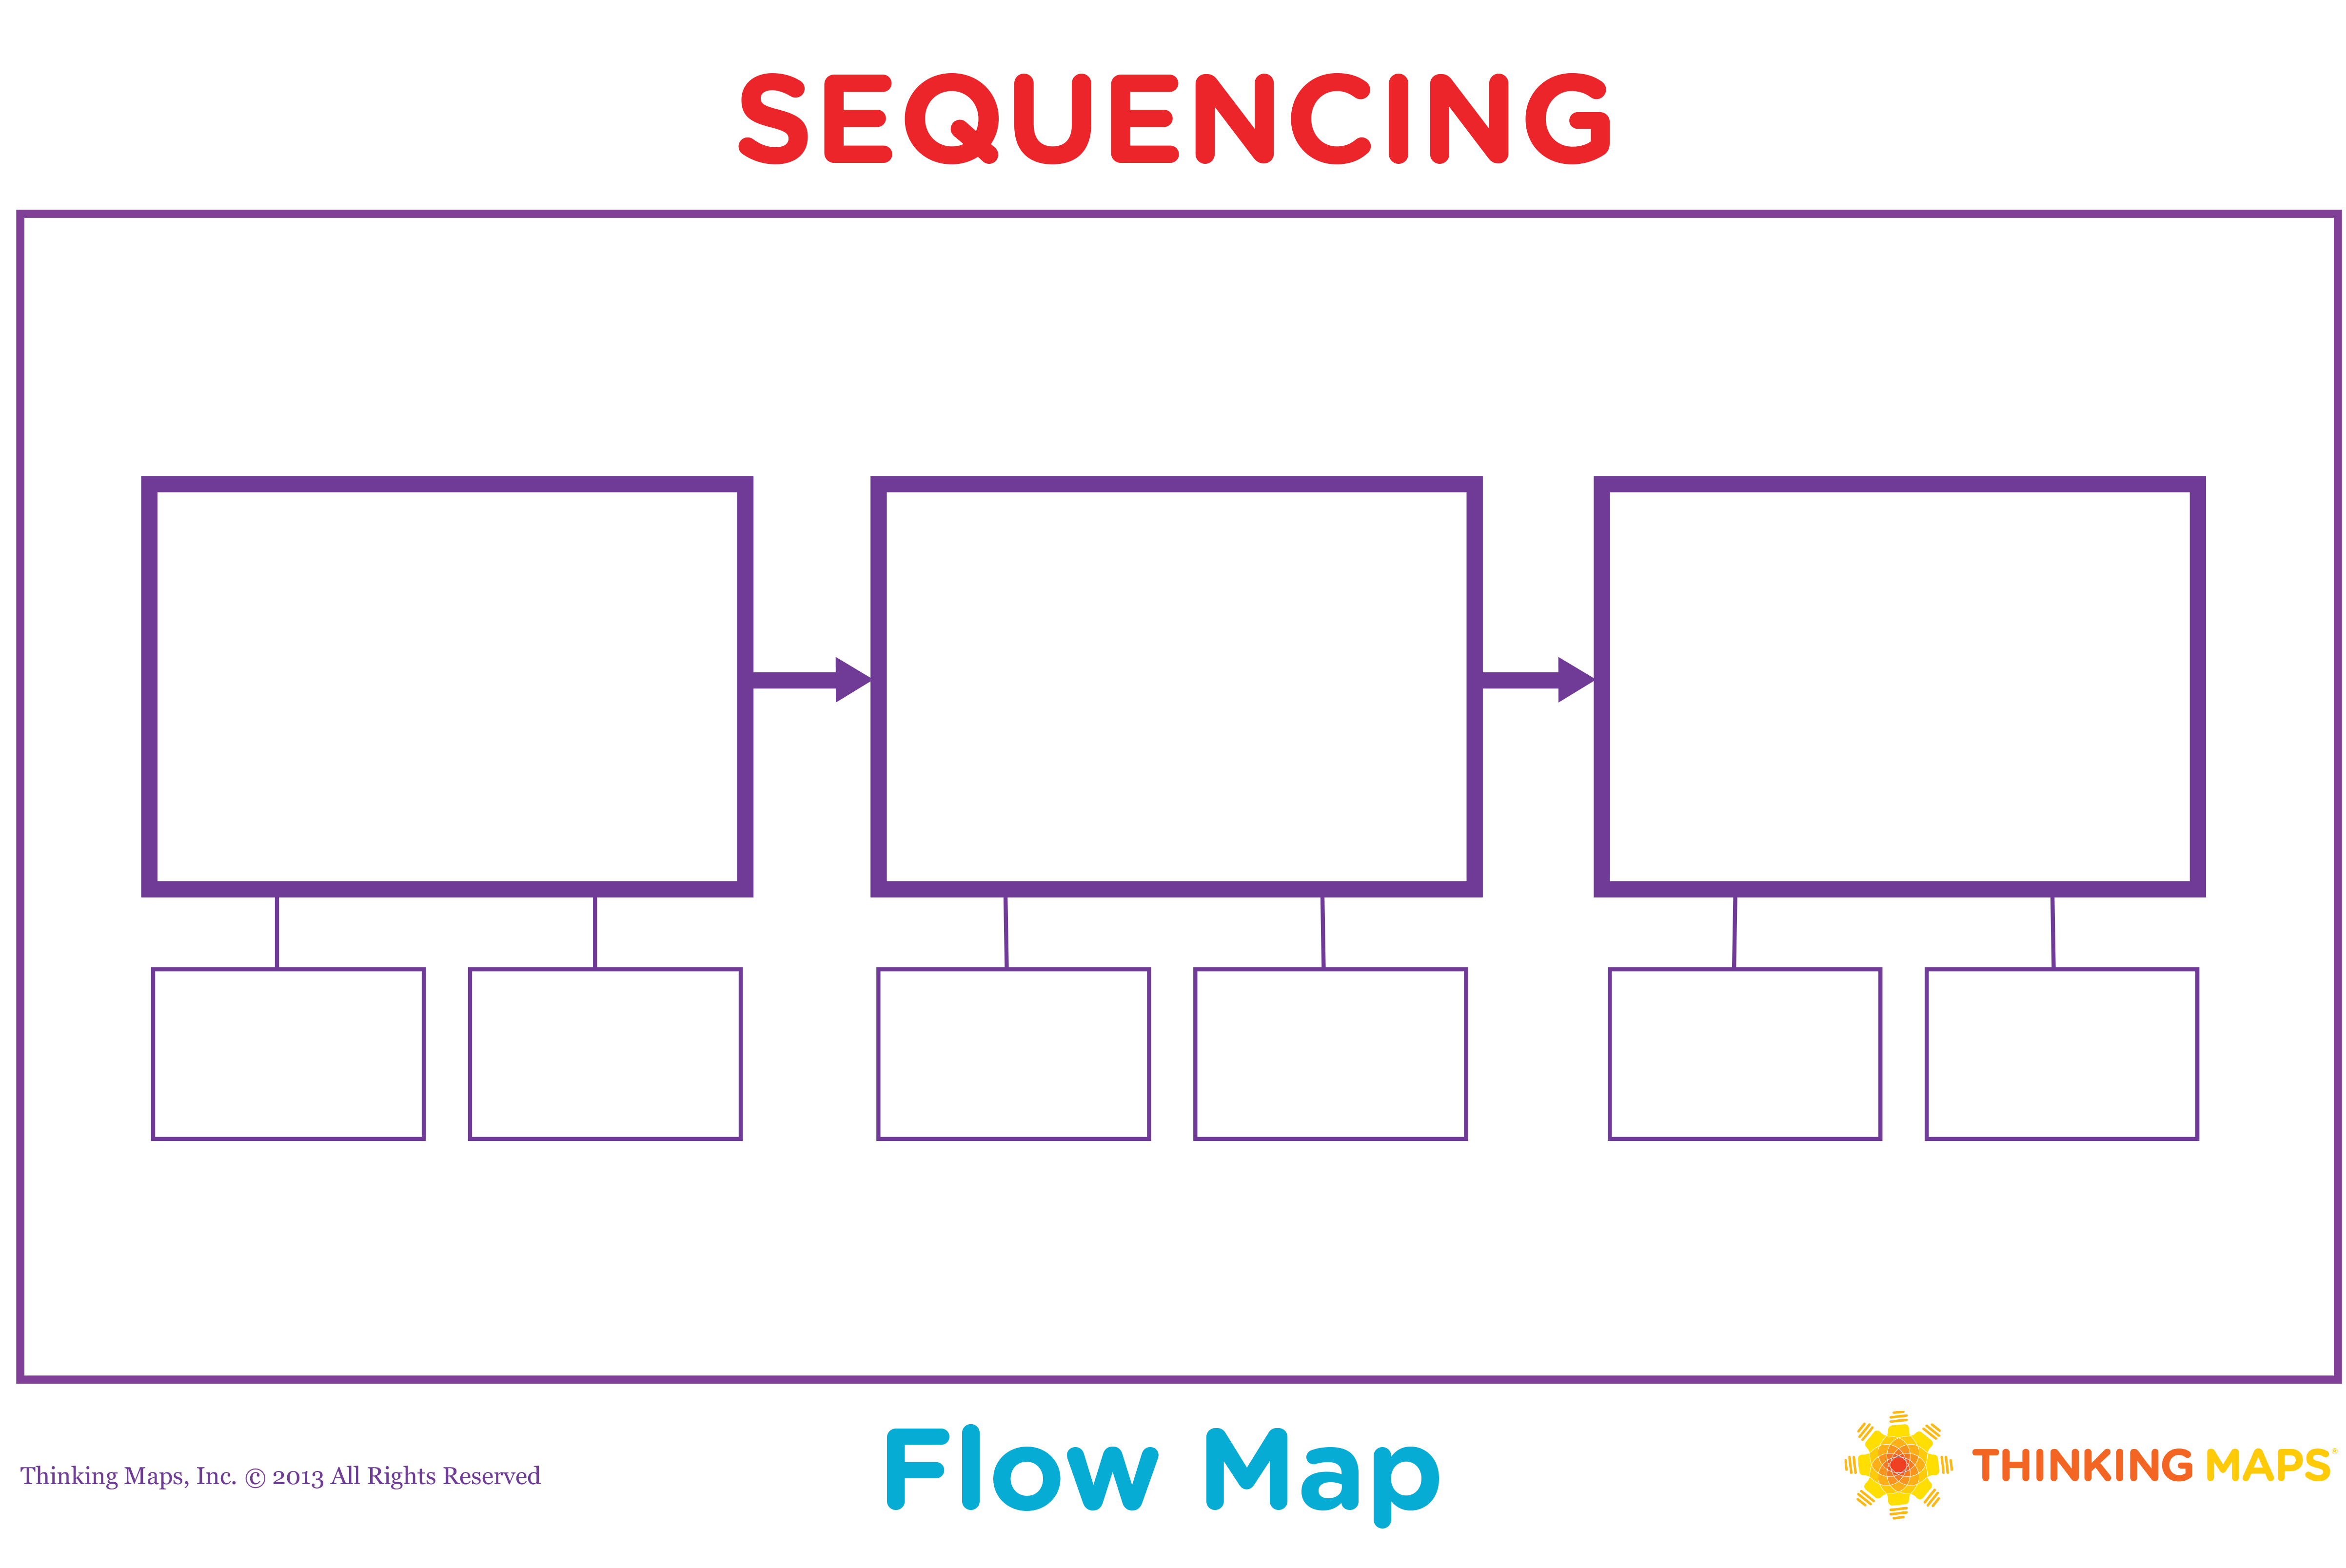
Image source: edrawsoft.com
4: Multi-Flow Map – Cause and Effect Analysis
Multi-flow maps specialize in analyzing through cause-and-effect relationships. The left section identifies contributing factors or causes, while the right section displays potential outcomes or effects.
In complex systems, effects can sometimes become contributing factors themselves, creating feedback loops and interconnected relationships. This makes multi-flow maps particularly valuable for comprehensive event analysis, helping users identify root causes and anticipate potential consequences.
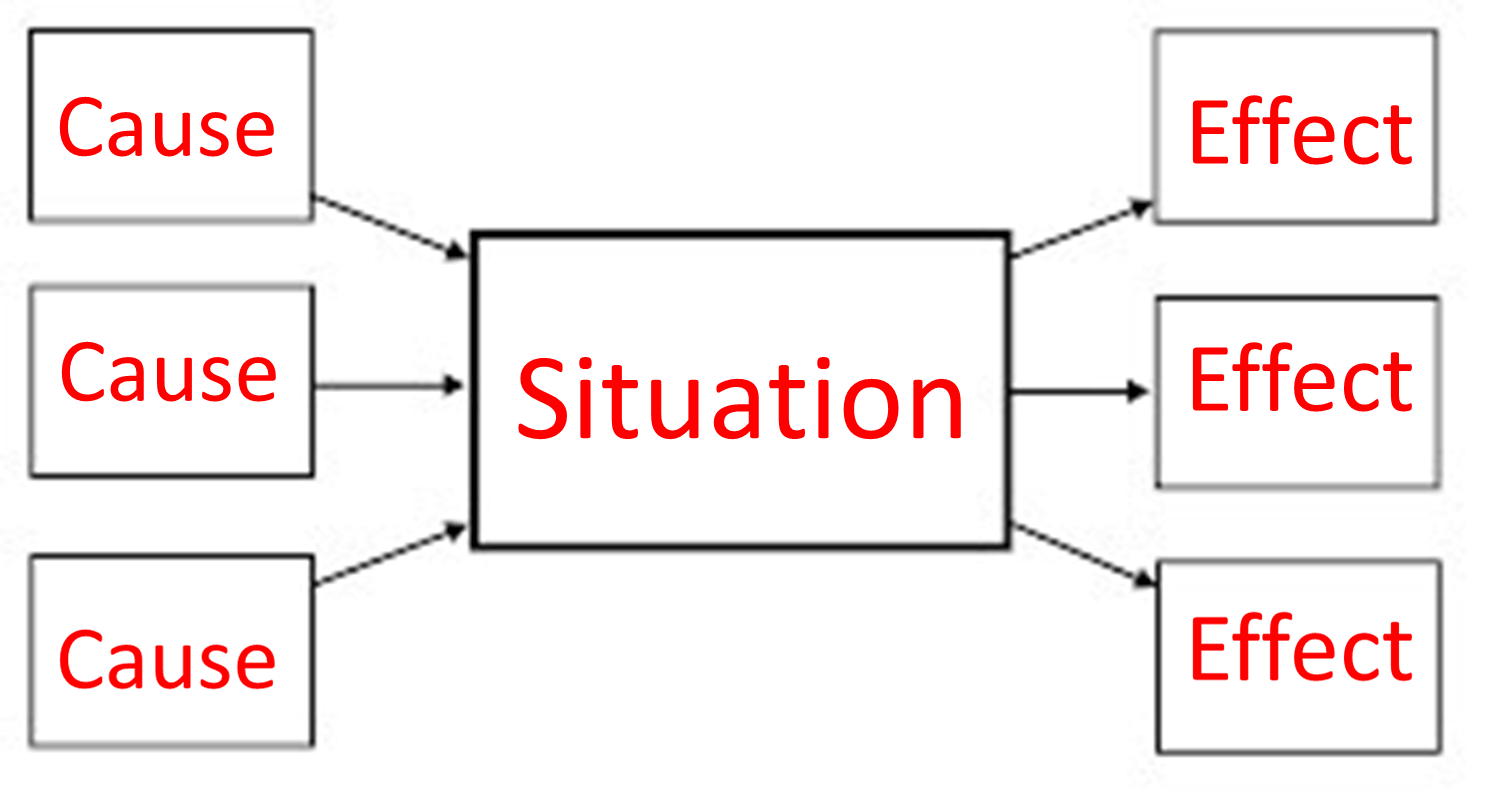
Image source: sites.google.com
5: Brace Map – Component Identification
Brace maps focus on part-whole relationships, breaking down subjects into their constituent components. Unlike tree maps, brace maps specifically address physical objects and tangible situations rather than abstract concepts.
In educational contexts, science teachers frequently use brace maps to organize experimental materials and procedures. Biology classes might use brace maps to illustrate plant anatomy, breaking down plants into three main sections with subsequent subdivisions. This organized approach helps students understand complex structures through systematic decomposition.
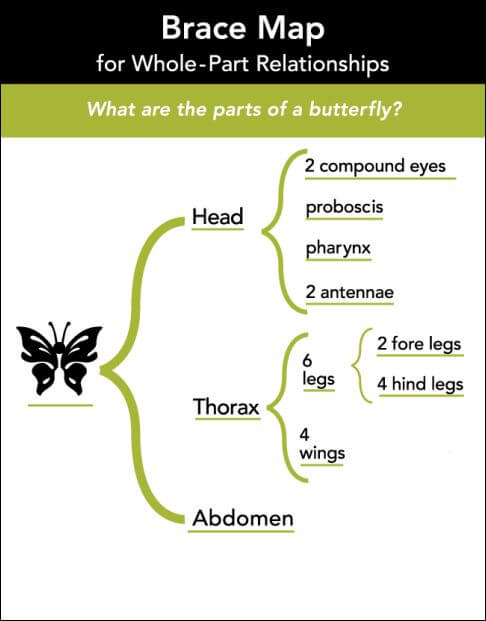
Image source: pinterest
6: Treemap – Classification and Organization
Similar to taxonomic structures, treemaps organize information through classification systems. The main category appears at the top, with related subcategories and specific examples branching below in hierarchical fashion.
Primary education frequently employs treemaps for teaching animal classifications and mammalian families. This organizational approach helps students systematically grasp and retain fundamental knowledge across various subjects.
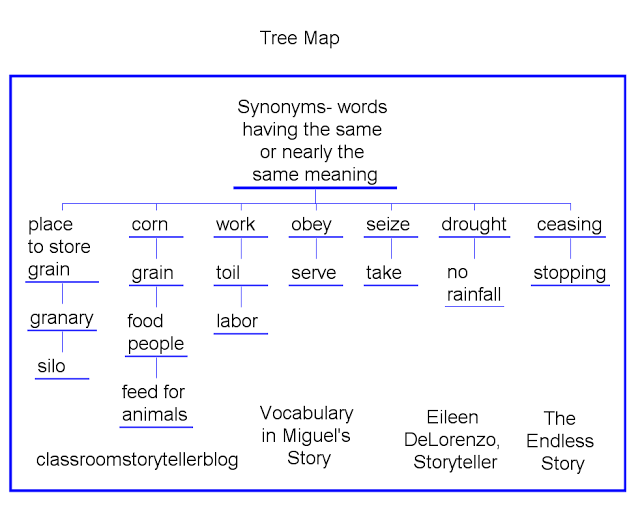
Image source: eileendelorenzo.com
7: Double Bubble Map – Comparison and Contrast
The double bubble map combines two bubble maps to facilitate comparison and contrast analysis. Shared characteristics appear in overlapping sections, while unique attributes remain in separate areas.
Compared to Venn diagrams, double bubble maps offer superior visual organization through clear separation of comparison points. Literature students frequently use these maps for character analysis, plot comparison, and thematic exploration across similar literary works.
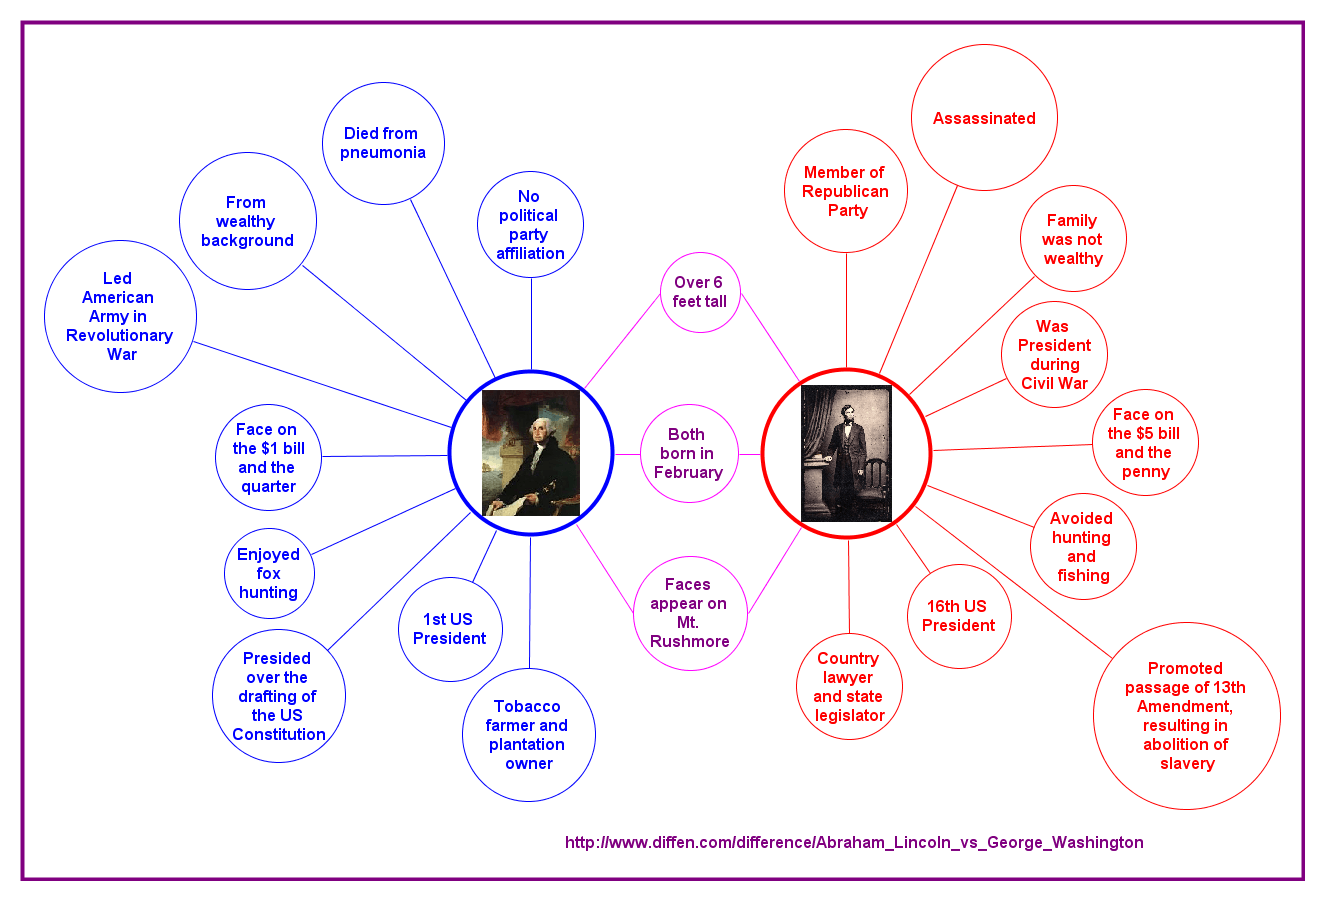
Image source: thinkingmaps.com
8: Bridge Map – Analogical Relationships
Bridge maps help users identify similarities and create analogies between different concepts. This approach leverages natural learning patterns where people understand new information by connecting it to existing knowledge.
These maps create conceptual bridges between familiar and unfamiliar concepts, accelerating comprehension and retention. Nutritional education provides excellent examples, where bridge maps can connect everyday foods (like oranges) with their nutritional components (vitamin C), creating memorable learning connections for students.
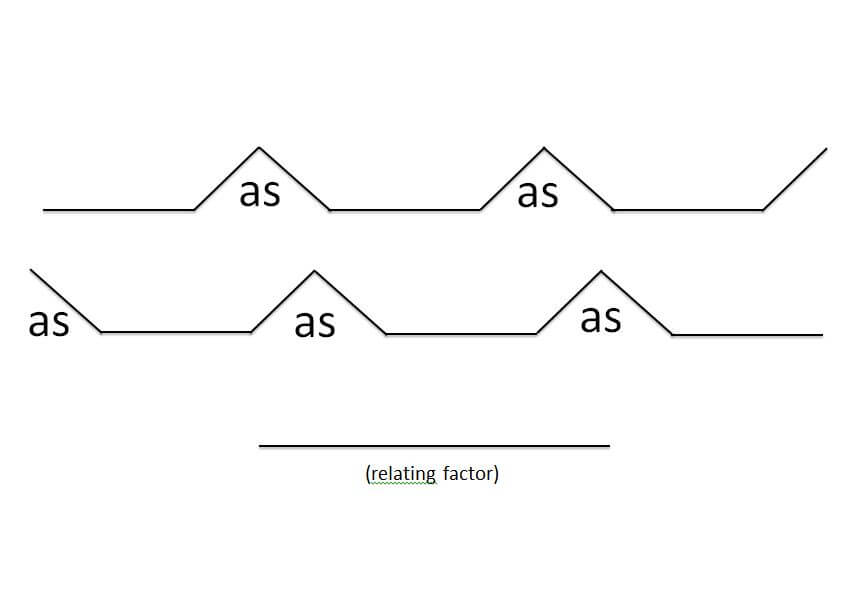
Image source: osborne10thlit.com
EdrawMax
All-in-One Diagram Software
- Superior file compatibility: Import and export drawings to various file formats, such as Visio
- Cross-platform supported (Windows, Mac, Linux, Web, Android, iOS)


Step 1: Define your purpose and intended use for the thinking map
Step 2: Select the thinking map type that best matches your objectives
Step 3: Input your content and organize information accordingly
Step 4: Save your work and export in your preferred format
Practical Example:
To understand student interests, I would select a circle map as my approach. The central topic would be "animal learning," with students contributing their questions and interests in the surrounding circle. This information then informs class design, ensuring content aligns with student curiosity and engagement needs.
Thinking maps offer substantial benefits across educational and professional contexts, with each map type serving specific cognitive purposes. These visual tools help users simplify complex knowledge, organize thoughts systematically, and enhance information retention. Educators should incorporate diverse thinking maps into teaching methodologies to make knowledge more accessible and engaging. This visual approach ultimately leads to improved academic performance and deeper understanding.
Explore EdrawMax to create comprehensive lesson plans that outline your instructional content through structured, step-by-step visual frameworks.

