


In many kinds of work, data visualization is king.
It's presenting information visually rather than in boring spreadsheets or documents. This way, you and your teammates can quickly analyze voluminous content. With data visualization tools like diagrams, there is a lot of progress to be made in terms of work.
One effective way to visualize data flow is through a Sankey diagram. This example uses arrows or paths with different widths to show the distribution of resources or energy. However, this may be the first time you might have heard about this, because not many people know. If you want Sankey diagrams explained, read this article.
In this article
What Is a Sankey Diagram?
This guide helps you get into what makes a Sankey diagram. As mentioned earlier, it's a flow chart that illustrates the movement of resources or data from one point to another. With the help of arrows or paths of varying thickness, it's easy to show the magnitude of the flow between different sources and targets. The rule of thumb is that with a thicker path comes a larger amount transferred.
This diagram was invented by the Irish engineer Captain Matthew Henry Phineas Riall Sankey. He popularized its use around 1898, when he first used it to depict the energy efficiency of steam engines. He used arrows to show the train's energy loss at certain stages of its operation. Over time, it has been adopted in different industries to present a more reliable flow of resources.
Main Use Cases
Due to its ease of use, many industries have availed themselves of the tool's functions. For example, in the energy sector, you'd often see Sankey diagrams to illustrate how energy enters, moves, and exits a grid or a house system. This makes it easy to identify waste and inefficiency.
It's also often used in marketing, where they are used to track customer journeys through a sales funnel. This helps reveal where potential buyers drop off. Lastly, people in finance also make use of this diagram. They show how money is allocated within a budget, and in sustainability, to highlight resource consumption and recycling patterns.
How It Works
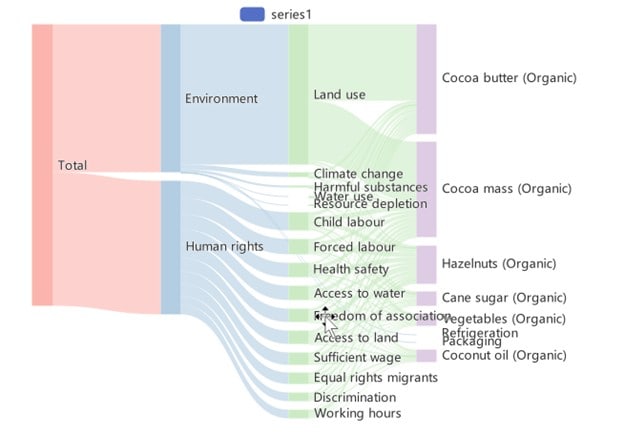
To recap, a Sankey diagram mainly uses arrows or paths to show a resource volume or quantity change. So, a Sankey diagram is built around two main elements: nodes and links. Nodes represent the sources or destinations of a flow, or the different stages the resources go through. On the other hand, links connect the nodes and represent the actual value or quantity of resources, data, and energy.
The width of each link is proportional to the quantity it represents. For example, a wider link might indicate a larger volume of energy consumed or more customers moving from one stage to the next. This proportionality makes it easy to compare flows at a glance. When designed carefully, the diagram shows where most resources are concentrated and where losses or inefficiencies occur.
Benefits of a Sankey Diagram
The Sankey diagram's benefits are easy to spot. However, to be more specific, here are some examples where they shine as a diagram or tool:
- Clear and intuitive visualization. You don't have to rely on numbers alone to show differences in quantity across a flow. Type in your nodes and arrange the path size; you'll get the idea.
- Identification of inefficiencies or major contributors. Since you can adjust the size of the resources as needed, it's easy to spot where the flow falls short.
- Wide applicability. As mentioned, different industries use this diagram, from marketing to engineering. Still, it can be used in many different ways within a company. For example, in an electric company, you can use it to represent the flow of a power grid, and, simultaneously, to describe distribution and operational costs.
Limitations of Sankey Diagrams
While these Sankey diagrams are powerful tools, they are not without drawbacks, such as the following:
- Cluttering of data. When you use Sankey diagrams, there is a big chance that there is a lot of stuff to consider in a particular flow. This is especially the case in technical industries like engineering. Thus, if you try to fit too much information into the node-link structure of the Sankey, it might be overloaded.
- Hard to understand for first-time viewers. Just look at the Sankey diagram, and you'll see how hard it is for beginners to understand. One downside of this diagram is that you'll have to have a session to explain its contents to your people. However, once they know it, the benefits are worth it.
- Requires careful planning. Unlike other diagrams, the Sankey must be made with complete data. Otherwise, its benefits won't be appreciated. After all, it's focused on providing the differences in resource distribution across a long flow - hence, you must finish doing the flow first and collect your data.
How To Make a Sankey Diagram
Now that you understand what makes a Sankey diagram great (and otherwise), it's time to know how to make them if you want to use them for your company or work.
Creating a Sankey diagram may look simple, but its structure can get tricky quickly. Unlike basic bar or line charts, you deal with multiple nodes and links that must be scaled proportionally. That's why it's best to use a dedicated diagramming tool. Here's a sample workflow, though:
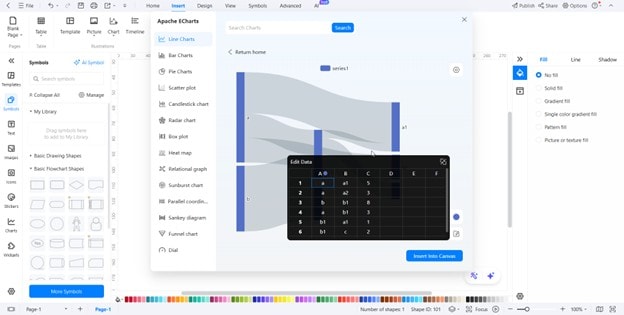
Step1Input Your Data
- Start by listing your sources, intermediate stages, and end points.
- Each connection between two stages, called a link, needs a value. This could be the energy lost in a system, the number of customers moving to the next stage, or dollars allocated to a department.
- Enter these values into your tool so it can calculate link widths automatically.


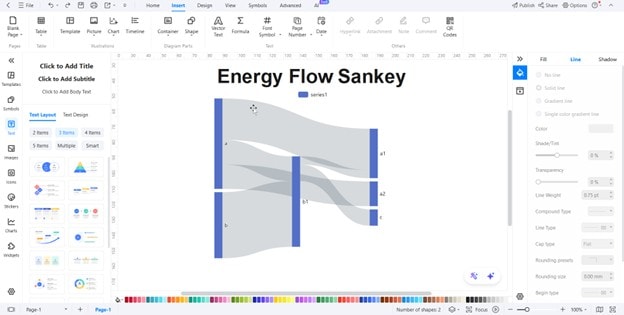
Step2Style Your Diagram
Once the framework is ready,
- Adjust colors, label positions, and font sizes for clarity.
- Group smaller flows together if the chart feels crowded. The goal is to make the main paths stand out at a glance.
Step3Save and Export
When you're satisfied with the design,
- Save your project and export it as an image or PDF. It's now ready to share.
A Dedicated Tool To Make Sankey Diagrams: Wondershare EdrawMax
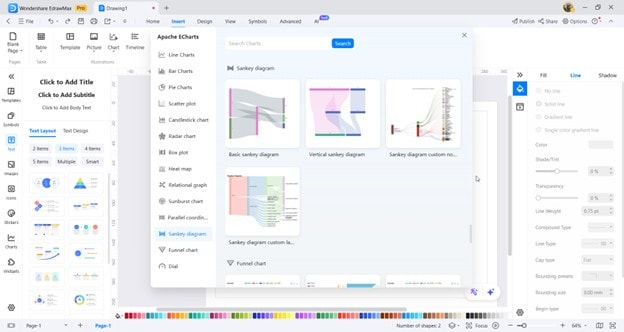
As mentioned earlier, using a dedicated tool is the easiest way to create a Sankey diagram. These diagrams rely on proportional links and precise alignment, so manually building one can be frustrating and time-consuming. Wondershare EdrawMax solves this problem by offering a complete set of features designed specifically for flow-based charts.
EdrawMax has a wide selection of templates that let you start quickly, even if you're new to diagramming. Its AI tools help you organize nodes, adjust link paths, and generate balanced layouts automatically. You can customize elements such as colors, labels, link thickness, and fonts. This way, you can match your brand or presentation style.
How EdrawMax Helps in Making Sankey Diagrams
Since Sankey diagrams can be tricky to make manually, EdrawMax's dedicated tools make them easy. All that's required of you is to provide it with data, and it'll automatically adjust the width of the lines or arrows. Furthermore, it helps keep the diagram neat even when you add a lot of nodes. Aside from putting in data, you can spend much more time customizing the diagram.
Furthermore, you can use its AI tools to help you in other matters you'll need while doing the Sankey diagram, such as calculating and more.
Tips for Making Effective Sankey Diagrams
Like any other diagram, a Sankey is only effective if it's easy to read and understand. Due to the complex nature of the data behind the diagram, it can get too cluttered, as mentioned earlier. Hence, here are some tips you can take into account when making your own:
- Keep it simple: avoid overcrowding. Too many nodes and links can overwhelm viewers. Focus on the most critical flows and group smaller, less relevant ones together. This keeps the chart readable and highlights the key story.
- Use contrasting colors for clarity. Color plays a significant role in guiding the eye. Choose colors that stand out from each other, especially for main paths. Neutral backgrounds help the flows pop.
- Label flows clearly. Clear, concise labels make a big difference. Place them close to the relevant paths and avoid long text that clutters the layout.
- Be mindful of scale and proportions. The width of each flow should match its value. Inconsistent scaling can mislead viewers. Double-check your data before finalizing the diagram so the proportions are accurate and visually balanced.
Final Thoughts
Sankey diagrams help you see how quantities move from one stage to another. The key is to keep the structure simple, let proportional widths explain, and label only what readers need. Start with clean data (sources, links, values), use contrasting colors to guide attention, and check that every flow's thickness matches its number. If the chart feels crowded, group minor paths or split the story into two views.
To make the process faster and more reliable, use a dedicated tool. Wondershare EdrawMax offers a Sankey mode, ready-made templates, and helpful AI features for layout and alignment. You get accurate scaling without guesswork, plus flexible styling for labels, colors, and fonts.
