Cause & Effect Analysis - 6M
Ready to Create a Fishbone Diagram? Start Now!
EdrawMax Fishbone Diagram Maker helps you create professional fishbone diagrams with ease. Use a built-in template or design your own unique style to visualize and solve problems. Give it a shot today.
Part 1: What are the 6Ms?
The 6Ms method is a powerful mnemonic tool used primarily in problem-solving and decision-making processes. The Cause and Effect Diagram, also known as a Fishbone Diagram, is highly effective for exploring and dissecting problems in production or industrial operations. This technique helps to identify the root causes of an issue and develop solutions to fix them.
The 6M method encourages a multi-faceted approach to problem investigation.
*To jump directly to more cause and effect diagram examples, please click here.
Click here to see the HD version of the template.
1. Download the 6M Method template by clicking here for free.
2. Use the EdrawMax fishbone diagram maker to open and customize this 6M Method template. Download the program using the buttons below.
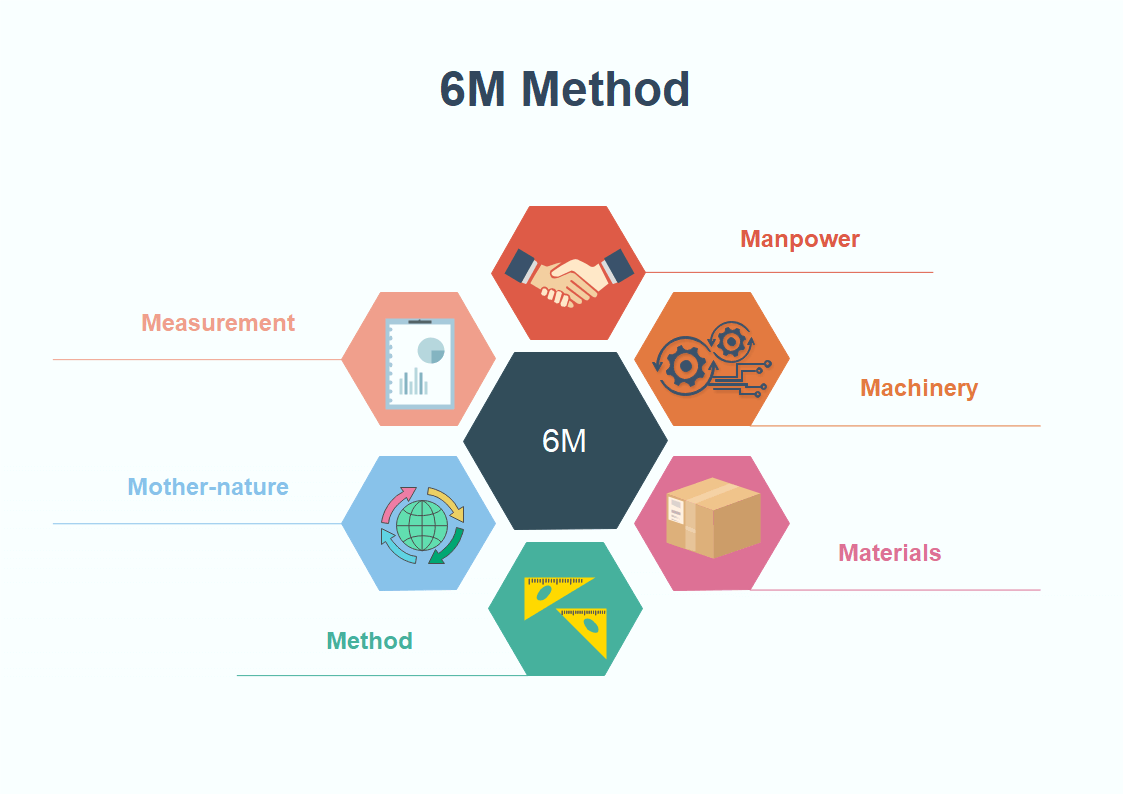
The 6M method is based on the following six key factors:
- Manpower: This category focuses on the operational and functional labor of the people involved in a process. It assesses the technical proficiency, experience, and overall quality consciousness of the staff.
- Machinery: This includes all machines, tools, and equipment, along with their underlying support systems. It evaluates whether the machinery is capable of delivering the intended output and is well-managed to achieve excellence.
- Material: This parameter covers the management of raw materials, components, and consumables. It ensures that materials have the correct specifications, are stored properly, labeled accurately, and used efficiently.
- Method: This refers to the production and support processes. It identifies any steps or activities that do not add value to the system and could be streamlined for greater efficiency.
- Mother Nature (Environment): This considers both controllable and unpredictable environmental influences on operations. It helps to account for factors like weather and other natural events that can impact a process.
- Measurement: This involves all inspection, evaluation, and physical measurements, whether manual or automatic. It is crucial for avoiding inconsistencies and errors by carefully monitoring calibration and other measurement challenges.
Part 2: How to Apply the 6M Method in Cause and Effect Analysis?
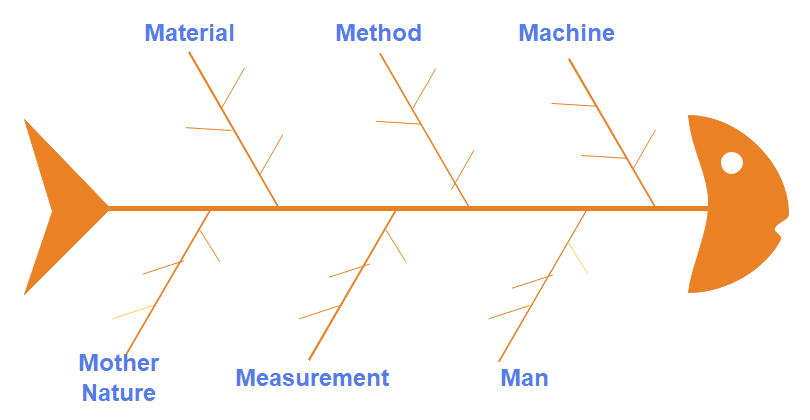
The 6M Method, when used with an Ishikawa Diagram, helps to center on a problem and explore its potential causes for comprehensive problem-solving. Also known as a Fishbone Diagram (due to its appearance) or an Ishikawa Diagram (named after its developer), this visual representation is a crucial tool for brainstorming and classifying problem dimensions. The 6M method facilitates the capture and organization of challenging issues under these six key categories.
Click on the picture to see more fishbone diagram templates.
Once an issue is identified, its causes are placed within the appropriate categories of the Cause and Effect diagram. This model empowers management to analyze problems from multiple perspectives. If a single cause seems to fit into different categories, a quick vote can determine the best placement, allowing you to move forward with improvement plans. These plans should prioritize the most significant issues first. The 6M Ishikawa Diagram is invaluable in this process, helping to categorize and rank causes and solutions based on their importance.
EdrawMax
Efficient Fishbone Diagram Maker >>
- Superior file compatibility: Import and export drawings to various file formats, such as Visio
- Cross-platform supported (Windows, Mac, Linux, Web)
Part 3: Examples of the 6Ms
The 6Ms in Cause and Effect Analysis provide a multi-faceted approach to solving problems in any organization or industry. The following examples demonstrate how useful this method can be for ensuring smooth operations.
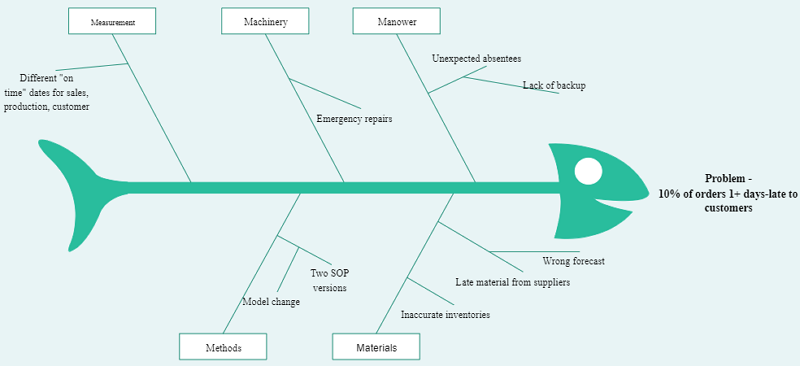
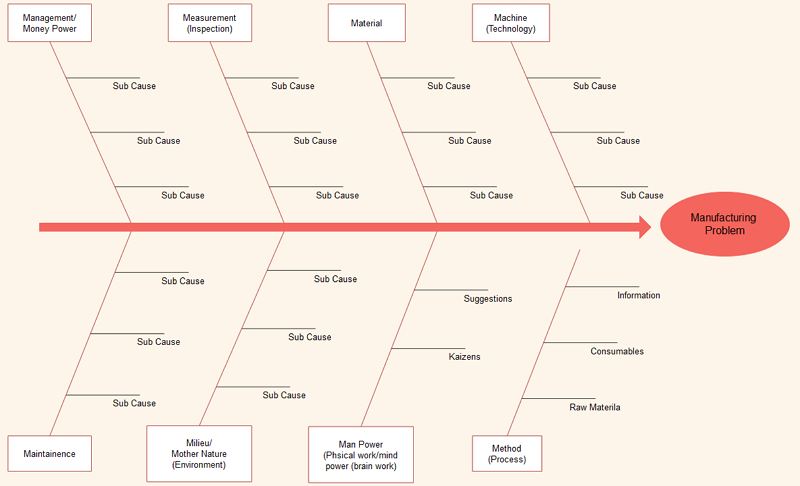
6Ms in Manufacturing
- Method: This includes specific regulations or policies that might cause production slowdowns.
- Mother Nature (Environment): This category addresses environmental factors, such as high moisture or low temperatures, that can affect production processes.
- Manpower (People): This focuses on issues related to staff, such as ensuring new employees are adequately trained and that training is consistent across the team.
- Measurement: This involves verifying that equipment is regularly calibrated and maintained to prevent errors in calculations or contaminations that lead to false readings.
- Machine: This covers maintenance issues with tools and machines, as well as the number of available machines for operations.
- Materials: This addresses issues with raw materials, including sourcing from suppliers, transport challenges, and quality control of supplies.
6Ms in Marketing
- Market: This involves identifying the target market to achieve marketing goals efficiently and save time and money.
- Message: This is about crafting the right message to differentiate your brand from competitors.
- Media: This determines the most effective media channels and mechanisms for delivering your message to the target audience.
- Money: Once the market, message, and media are defined, this involves setting a budget for marketing and allocating funds appropriately.
- Manage: This is the execution of your marketing plan, ensuring everyone involved has clear tasks and timelines to get everything done.
- Measurement: This involves monitoring the results of your marketing efforts to consistently generate the right number and type of leads.
Part 4: Defining the 4Ms, 5Ms, and 8Ms
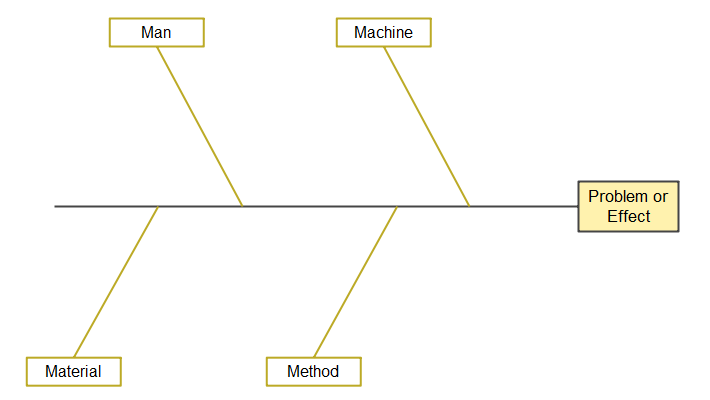
4Ms
The 4M framework is a fundamental structure for problem-solving that helps pinpoint potential causes of production issues. This concept is widely used in organizations to empower every team member to become a confident problem-solver.
The 4Ms stand for Manpower, Machine, Material, and Method. The descriptions for these are the same as above. Other categories have sometimes been added to create a more comprehensive Ishikawa Diagram.
5Ms
The 5M Method is based on five core causes. This versatile version of the Fishbone Diagram is used to identify causes of risks, inefficiency, low quality, and other business process issues. It adds the **Management** aspect to the original 4Ms.
8Ms
The 8M Cause and Effect Analysis diagram expands on the previous models. The problem causes are categorized as Manpower, Machine, Material, Method, Management, Mother Nature (Environment), Measurement, and Maintenance. The 8Ms list and analyze all factors affecting the main problem, providing a more in-depth analysis.
Part 5: More Cause and Effect Diagram Examples
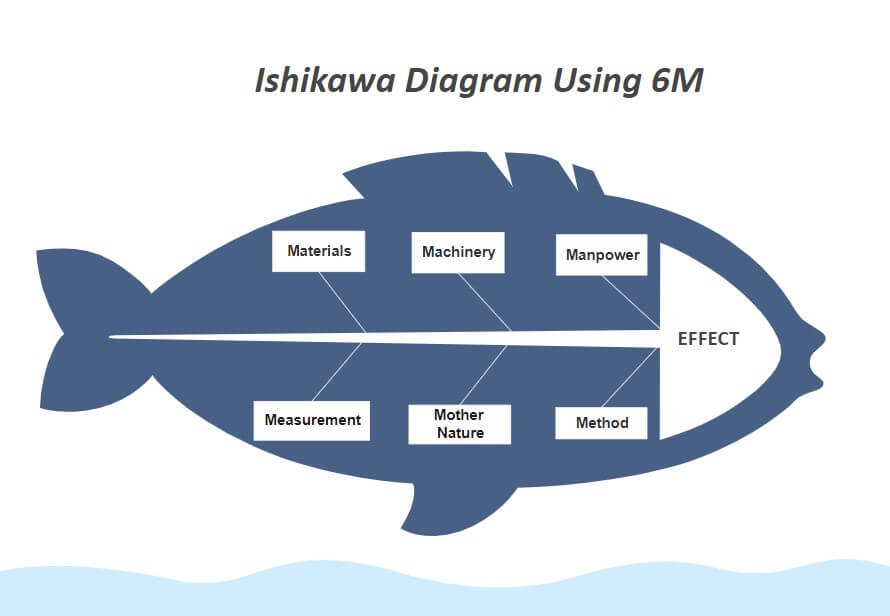
Example 1: Ishikawa Diagram Using 6M
The Ishikawa diagram is an excellent tool for examining a wide range of potential causes for a problem. In the manufacturing industry, these are referred to as the 6Ms: Methods, Machines, Materials, Measurement, Mother Nature, and Manpower.
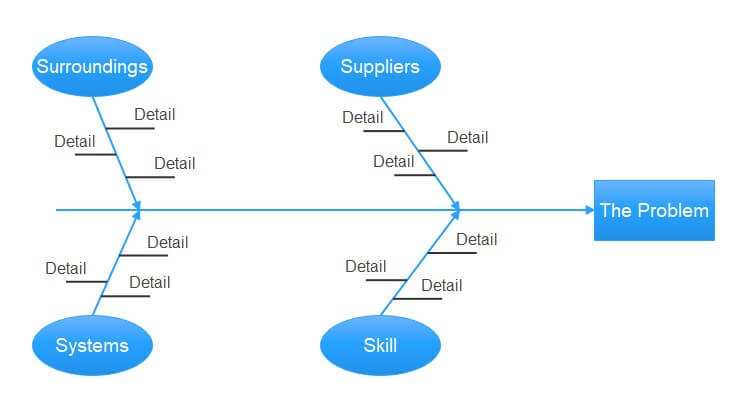
Example 2: 4S Model
In the service industry, the categories are often referred to as the 4Ss:
Surroundings – Does your firm project the right image? Is the environment welcoming or impersonal?
Suppliers – Are there issues with receiving low-quality materials? Are there any problems with service delivery?
Systems – Are good policies and procedures in place for all possible scenarios?
Skill – Do employees have adequate experience and training?
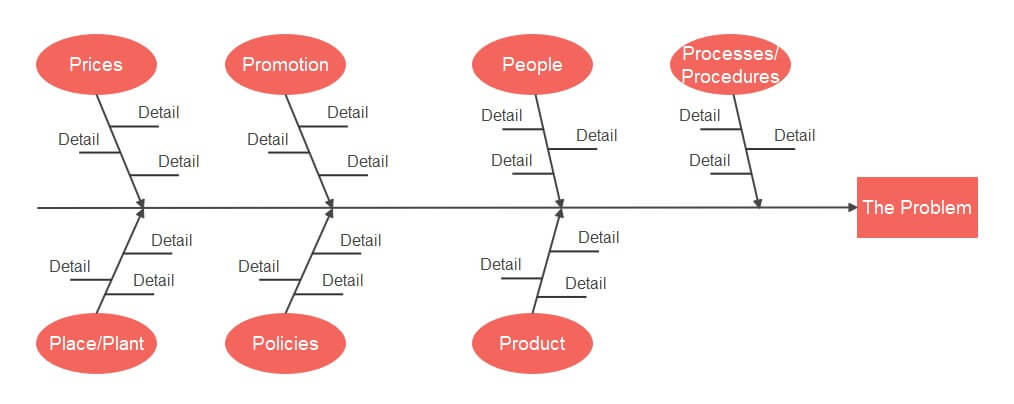
Example 3: 7Ps Model
In the marketing industry, the Cause and Effect diagram often consists of 7Ps. These relate to Product, People, Process/Procedure, Promotion, Price, Packaging, and Physical Evidence.


Get Started! You Will Love This Easy-To-Use Diagram Software
EdrawMax is an advanced all-in-one diagramming tool for creating professional flowcharts, org charts, mind maps, network diagrams, UML diagrams, floor plans, electrical diagrams, science illustrations, and more. Just try it, you will love it!
